Architecture Quality
High quality application development requires software architecture. On paper, it describes your technical choices, constraints, and is a reflection of business decisions. But the architecture may look very different once it is implemented in code. Objectively, badly implemented architecture is easy to see (like incoherence). To assess what is well-implemented architecture, we have to look broader.
Software architecture can seem abstract, but it is ultimately how the structure of your software facilitates the people working on it. The code will not care that it is highly coupled, but the people working on that code certainly do care about having dependencies on other people and teams. Sigrid can help you to both communicate the as-is architecture as it is actually implemented, and also help to find opportunities on how it can be improved.
A wide measure of Architecture Quality
When people talk about “legacy” or “monoliths”, they often mean much more than just outdated technology. What people usually mean is software that has become too fragile for changes to be timely, predictable, and reliable. Usually due to poor architecture or team knowledge loss. An architecture should be able to adapt to those changing circumstances. Therefore, we define architecture quality as the degree to which an architecture is flexible and adaptable to change.
So to make an assessment of architectural/future flexibility, we measure widely. Next to measuring the technical fundamentals, we also look at (code) evolution over time. For example the spread of code contributions over developers. We then compare your results against SIG’s benchmark to clarify what is going well and where improvement is needed.
Navigating to Architecture Quality
If Architecture Quality is available for your system, you can reach this view via the top menu, or by clicking an a capability on the System or Portfolio Overview pages. See the system-level Overview page or portfolio-level Overview page.
Architecture Quality overview
The overview page provides a summary of your system’s current architecture, relative to the other systems in SIG’s benchmark. The structure of this page is comparable to Sigrid’s maintainability summary: you have an overall rating, which is then split into a number of underlying system properties and associated ratings. Hovering your cursor over the system properties on the right provides you with a short description of each metric. For more information on SIG’s Architecture Quality Model, please consult the Guidance for Producers.
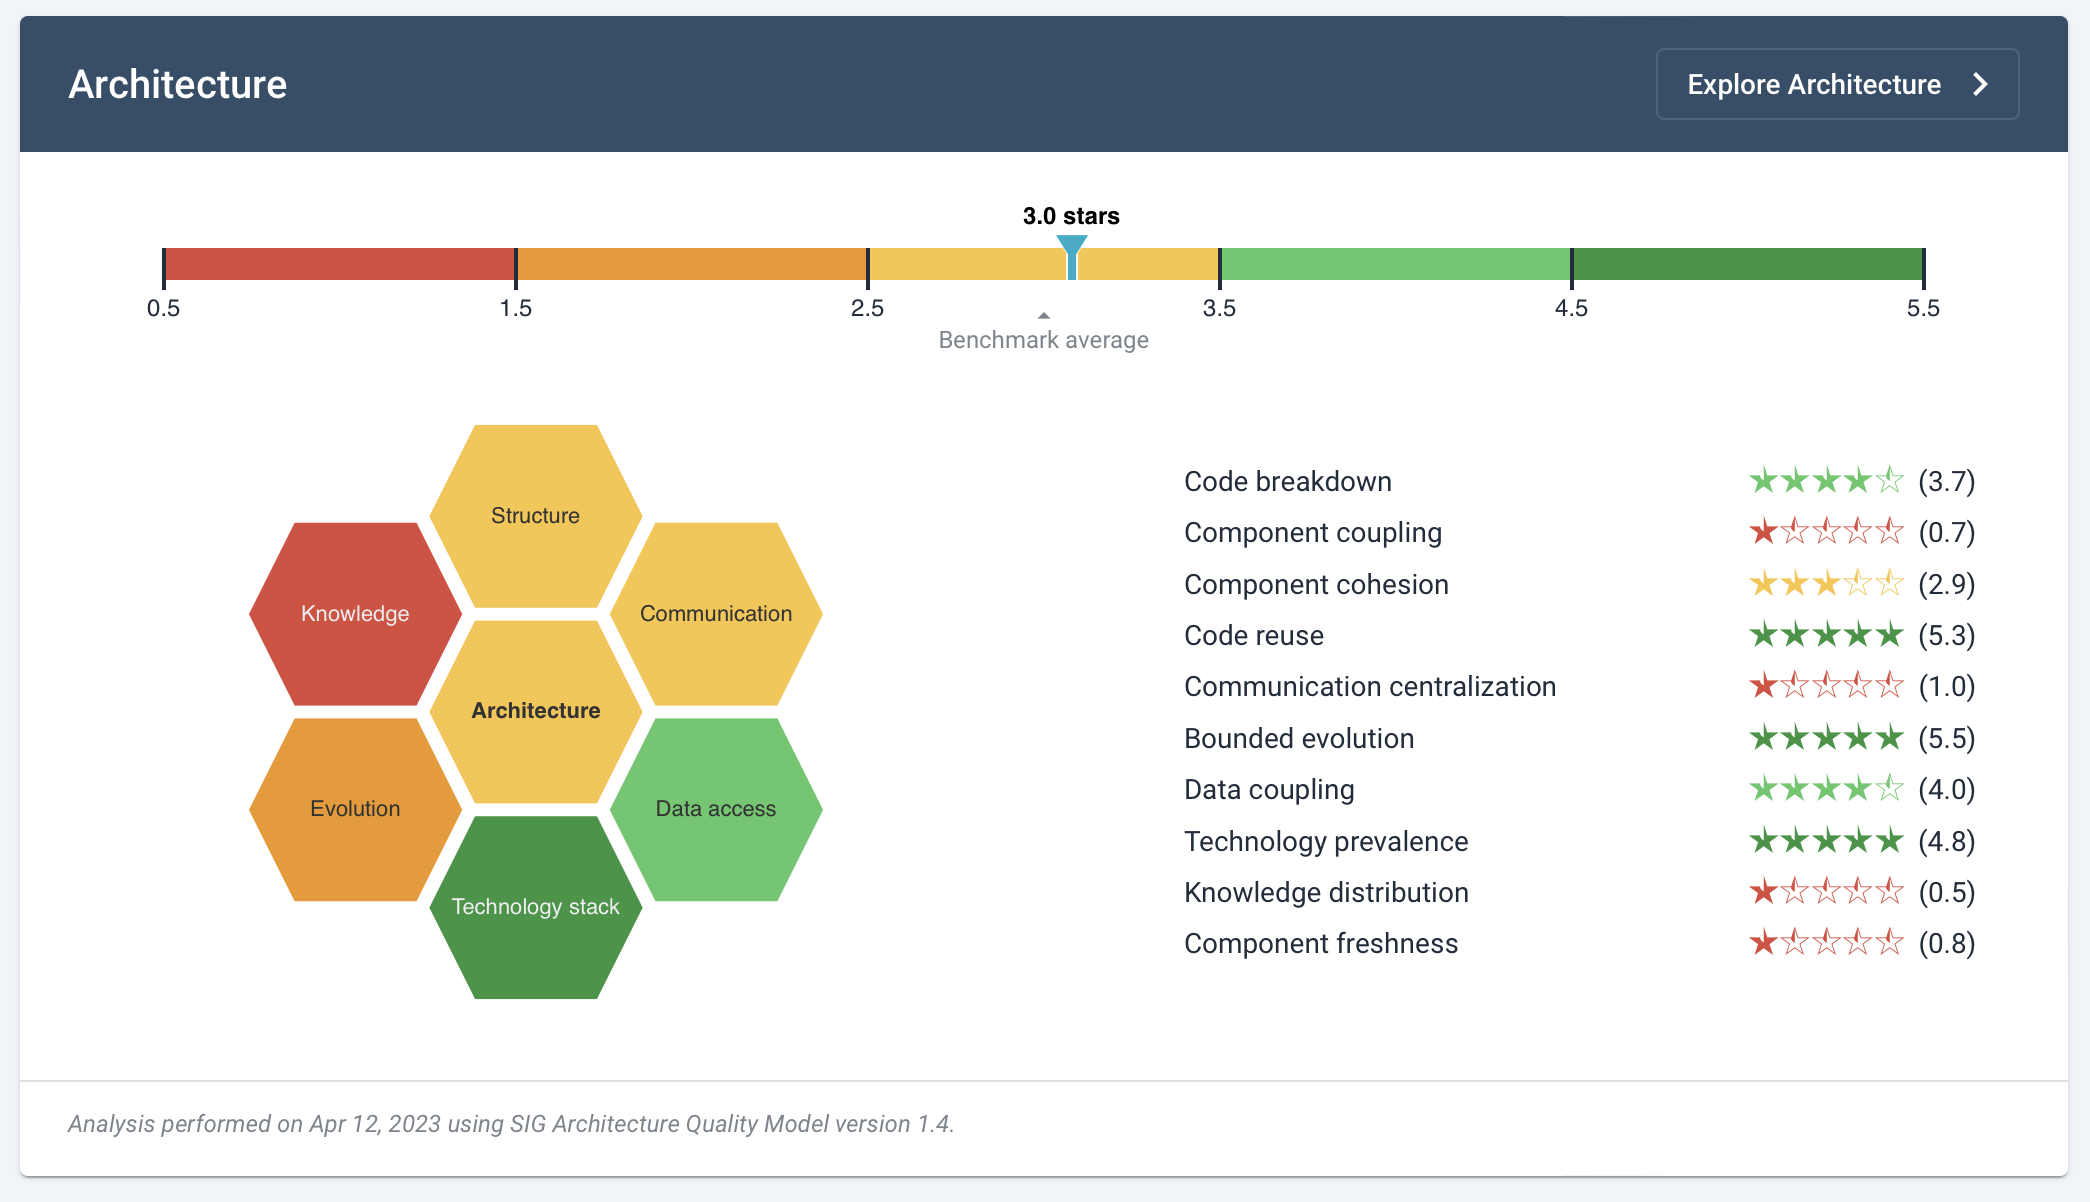
This page provides you with a summary, but you may decide that further investigation into your system’s current architecture is needed. You can use the “explore architecture” button to navigate to Sigrid’s architecture explorer page. Clicking on one of the system properties on the right will also take you to the architecture explorer page, but will then immediately jump to the system property you just clicked on.
Exploring your system’s as-is architecture
The architecture explorer page visualizes your architecture. Not the architecture that was initially planned, not the to-be architecture, but the implemented as-is architecture. The information used to provide this view is extracted from your source code, your repository history, and your configuration.
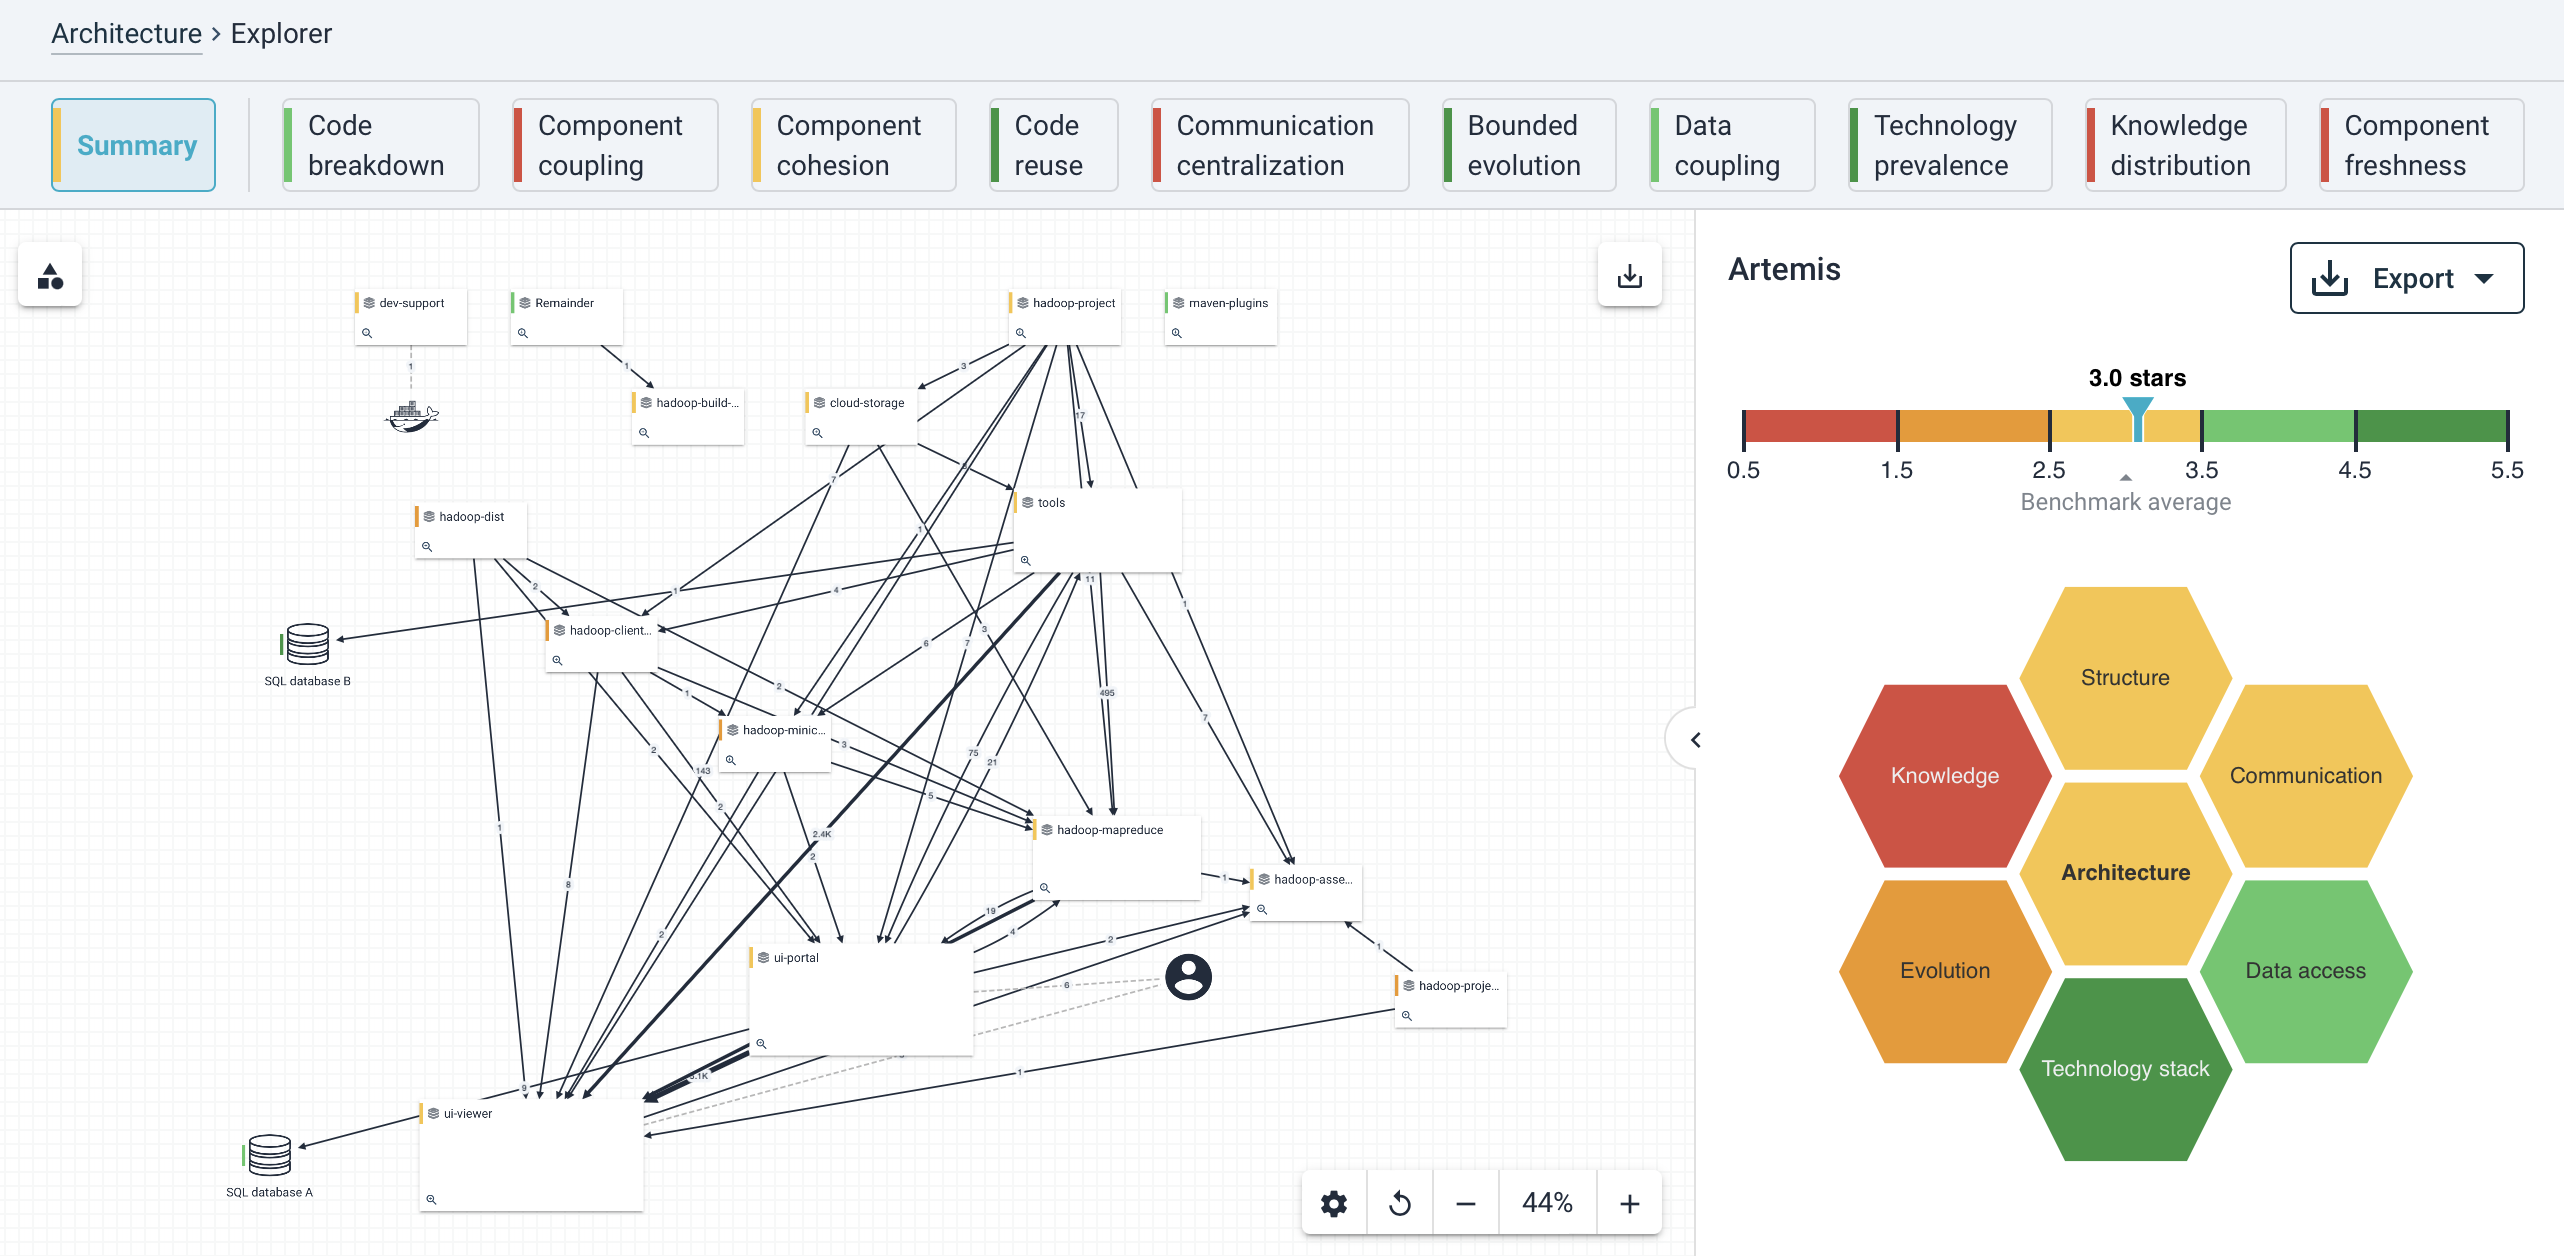
In this visualization, every “block” is a system element in your code. Depending on the terminology you use, this could be called a subsystem or a component. Arrows between the system elements indicate dependencies. Depending on your system, the view might show different types of dependencies in different colors:
- Code dependencies, for example Java calls.
- Interface dependencies, for example a REST API that is provided by one component and used by another component.
- Database dependencies, for example SQL queries.
- Hidden dependencies, for example duplication between two components.
You can use the “show legend” button in the top left to get more information on what each element in the visualization means.
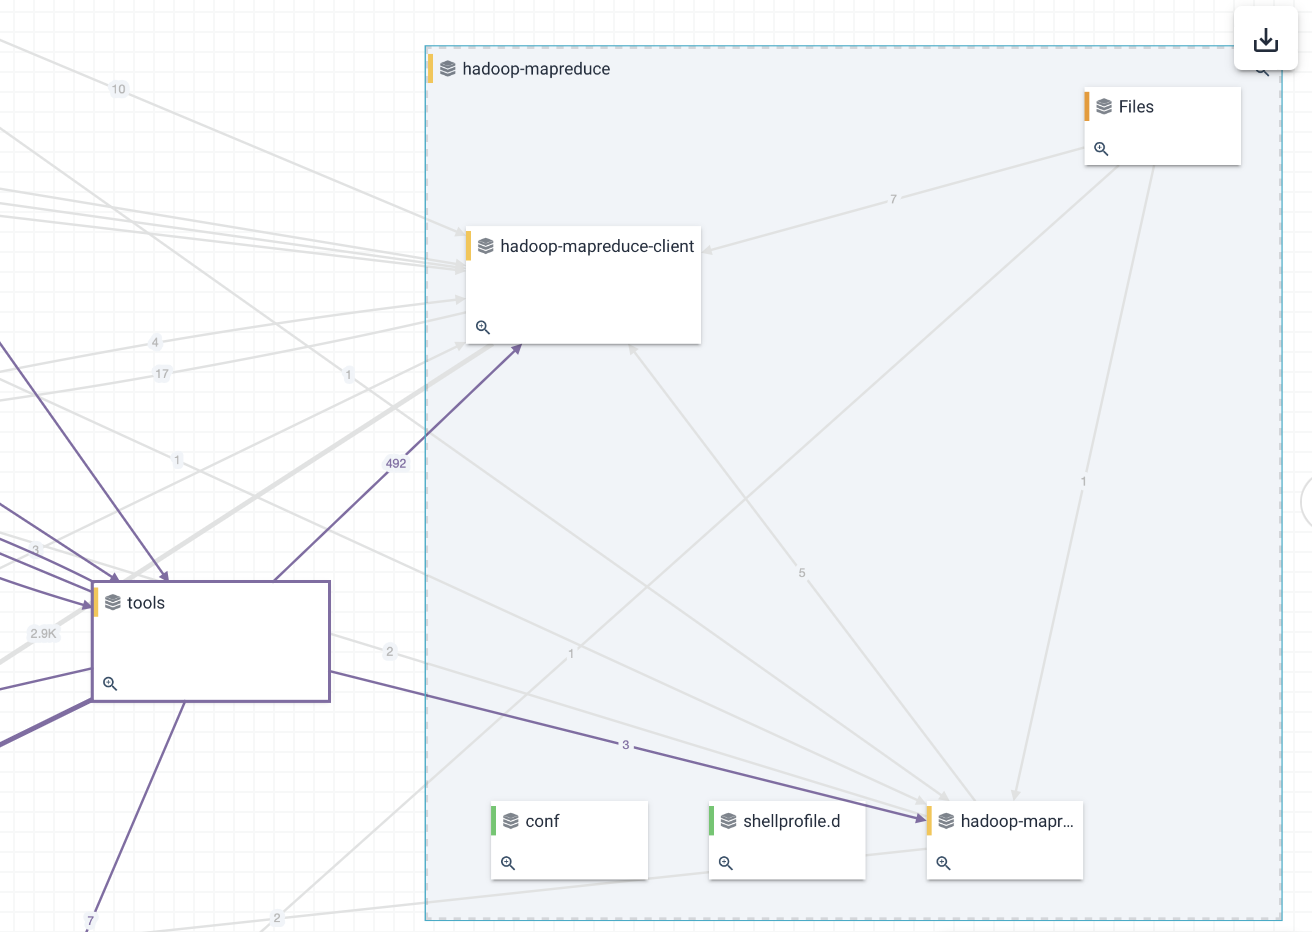
Each system element also includes a magnifying glass icon. Clicking this icon will “expand” the system element, which allows you to see its internal architecture. In many cases this low-level architecture is more actionable, as this is usually the responsibility of the team working on that system element. In other words: you need many people to discuss changes to your top-level architecture, but you can usually address issues in your internal architecture with your own team.
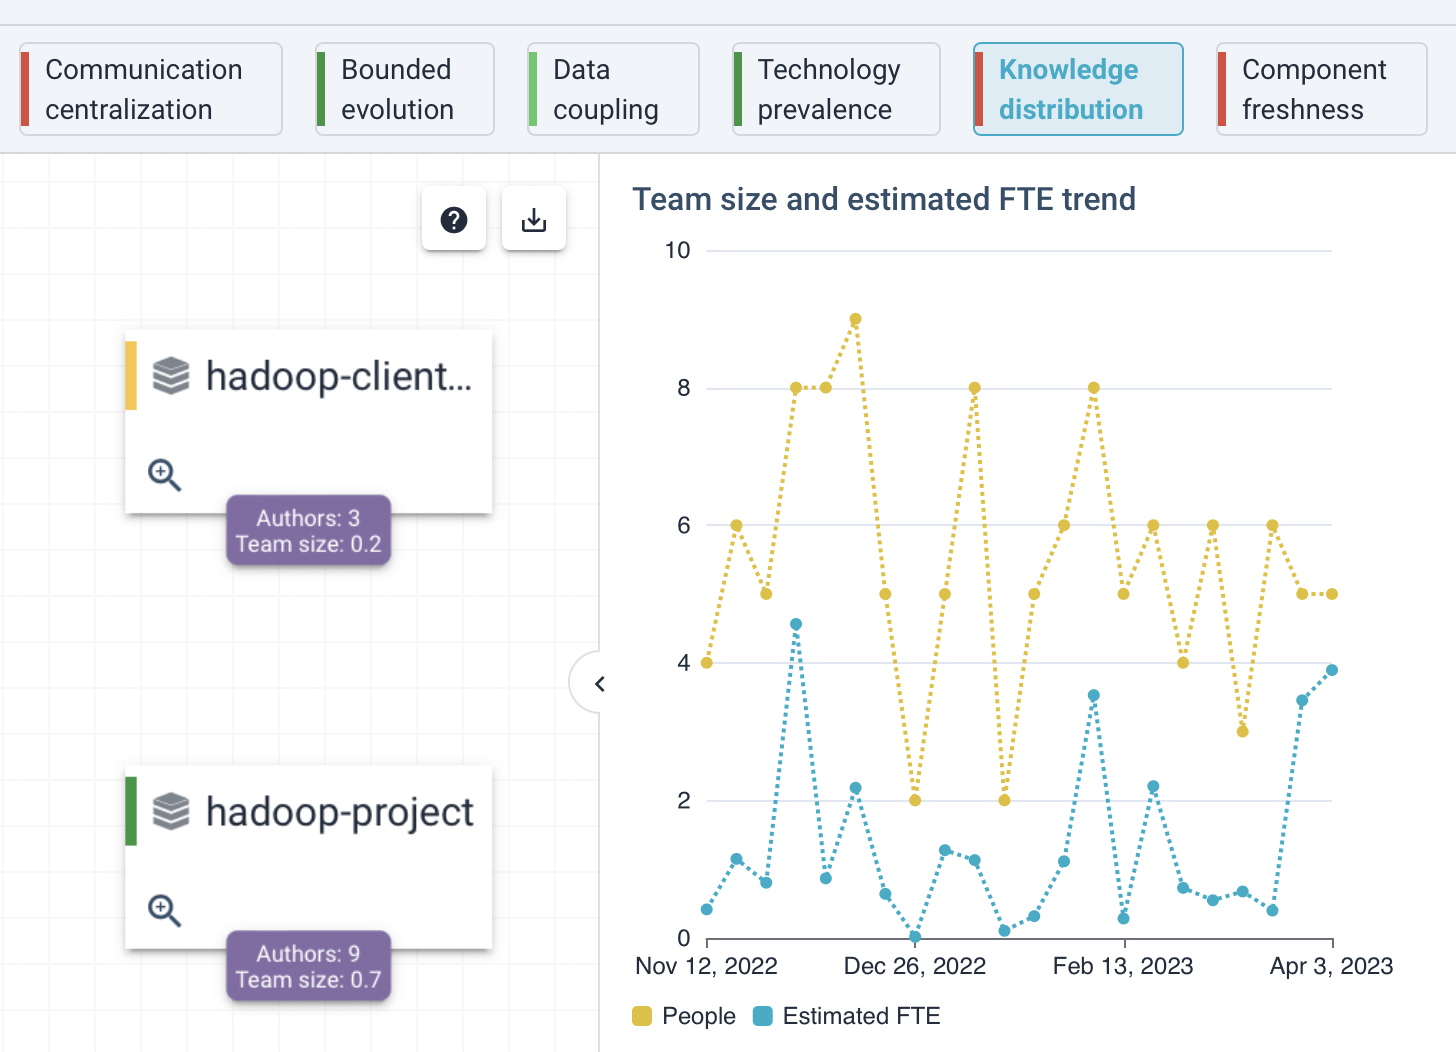
The different tabs across the top of the page represent the system properties in SIG’s Architecture Quality Model. Selecting a different tab will also change the architecture view, to provide more specific information relevant to that system property. It will also change the detail panel on the right, to expose more detailed charts and data relevant to the selected system property.
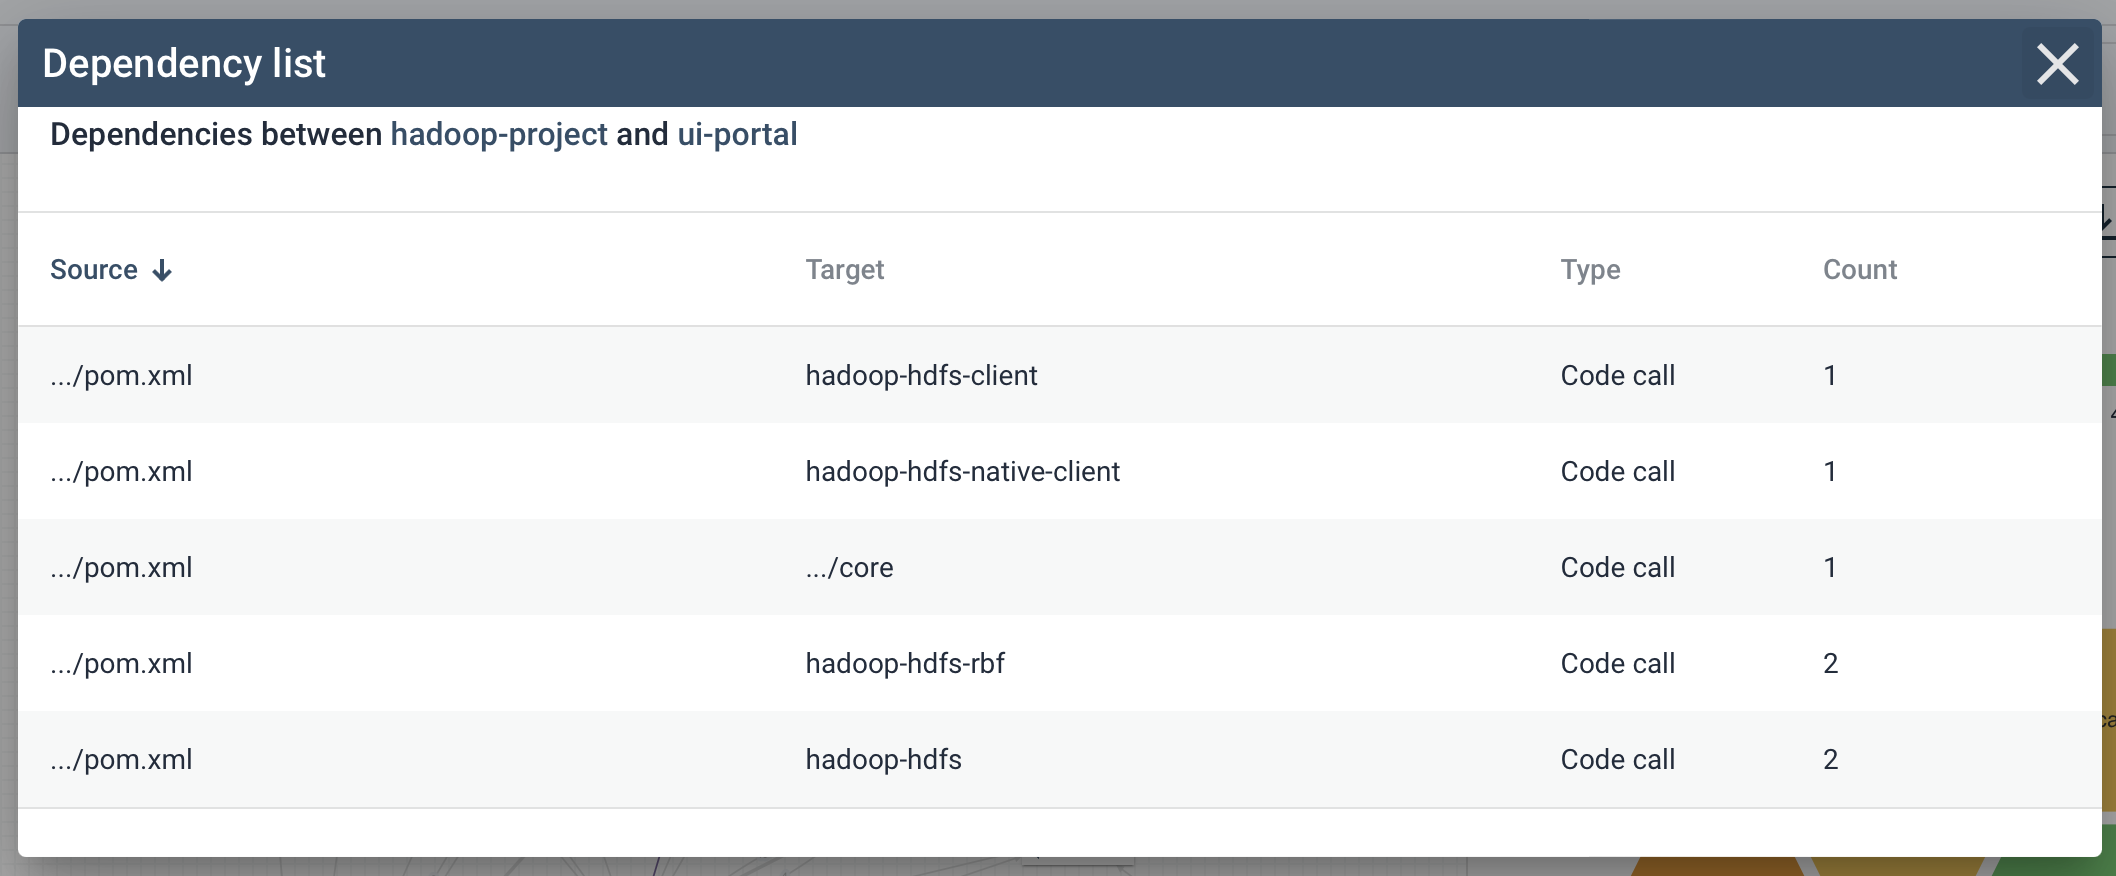
Clicking on a dependency will provide you with a list of where those dependencies originate in your code. If a dependency is connected to a file, clicking on that file will navigate you to Sigrid’s code explorer page where you can inspect the file and its source code in more detail.
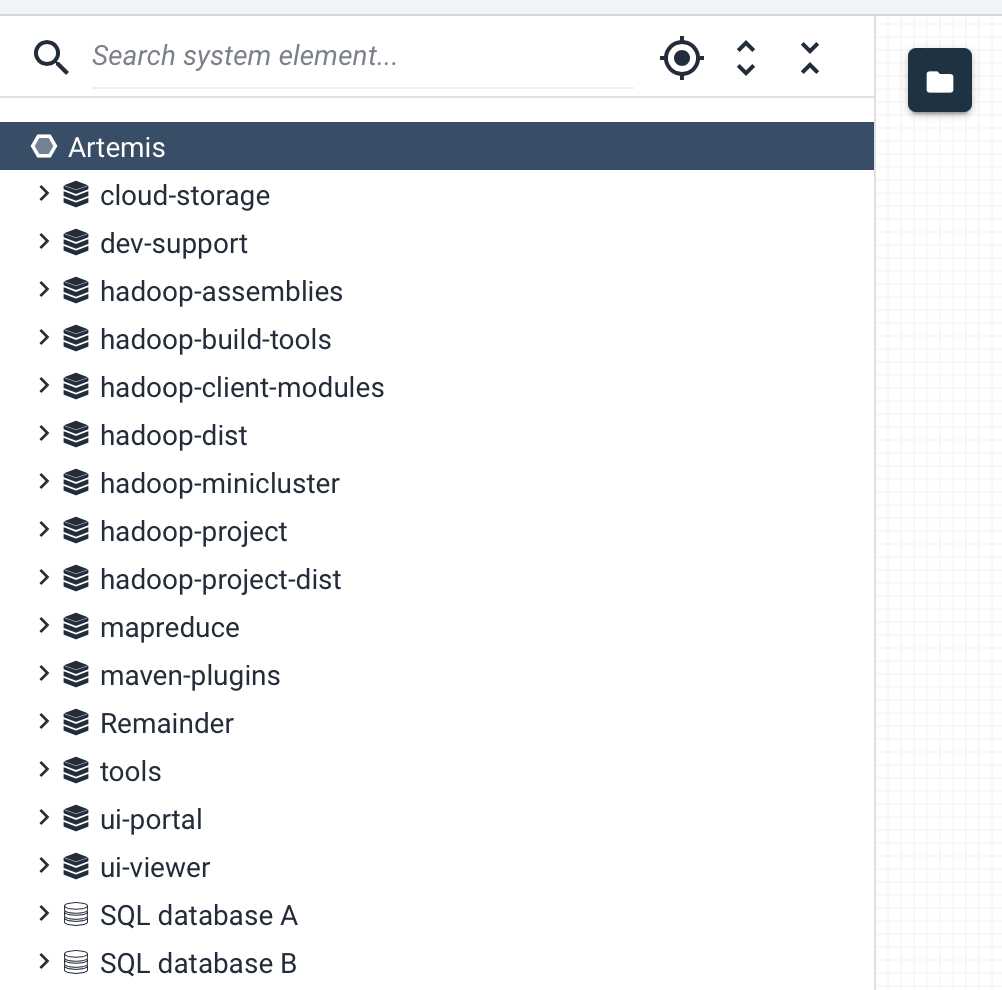
If your architecture contains a large number of components, it can be tricky to quickly identify a certain component in the architecture visualization. You can use the “folder” icon in the top left of the page to open the tree view. This provides you with a secondary way of navigating your architecture. Using the tree view is quicker in some scenarios, for example if you want to quickly check what files are located within a certain component. The tree view and the main architecture visualization are linked, so selecting a subcomponent in the tree view will also navigate to that same subcomponent in the architecture visualization.
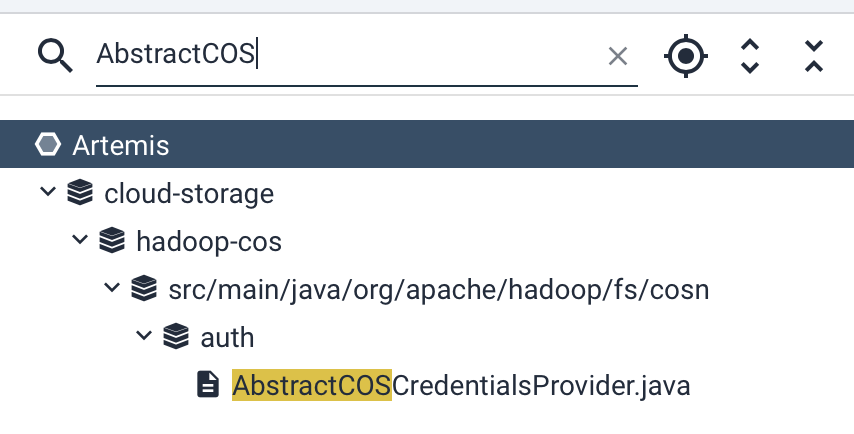
The tree view also includes a search option. You can use this to locate a specific system element within your architecture, such as a component, file, end point, or database. This is also linked to the main architecture visualization, so clicking on the search results will also navigate the main architecture visualization to that same system element.
Finally, the buttons around the page allow you to manipulate the architecture view:
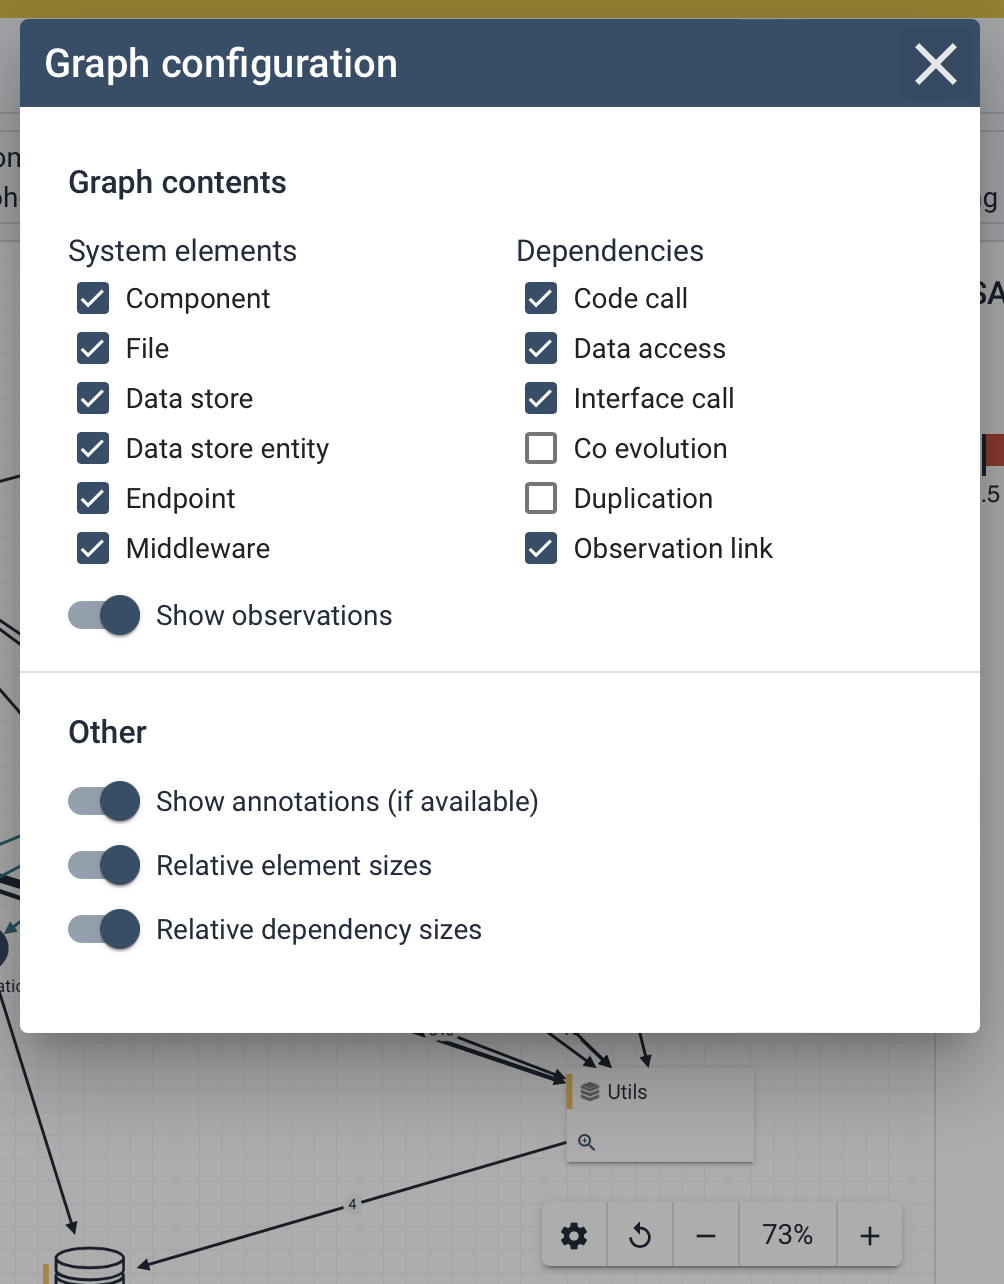
- The settings icon allows you to customize what is displayed, as depicted above.
- The “reset layout” button resets the architecture visualization to its original state, which can help to restore readability.
- The zoom buttons are an alternative way to zoom the architecture visualization, in addition to using your trackpad or mouse wheel to zoom.
Pinning and hiding architecture components
As most software systems are comprised of many parts, each with differing levels of dependencies between them, it can often be overwhelming to view the architecture in its entirety. In fact, it’s often the case that risk is localized across only a subset of the overall architecture while the majority of the remaining system elements can be safely ignored. As such, you will often want to target a specific set of components that have relations between each other while removing other components from view to more easily identify and triage these riskful hotspots without having to navigate through a mess of component and dependencies that are “muddying the waters” of your analysis.
Sigrid assists with this localized traige by allowing you to hide components (and their related dependencies) as needed. Alternatively, you can also “pin” components within the visualization to ensure they remain in view whenever you’re navigating the architecture. Using these controls together allows you to keep systems elements that have your interest in sight, while hiding away those that are not relevant.
Hiding and/or pinning of components can be done in multiple ways:
- When hovering over a component in the architecture canvas, two togglable icons will appear in the bottom left of the component’s box:
- A Pin icon which ensures the component remains in view regardles of other actions in the canvas.
- A Hide icon to force the component out of view until it is reshown.
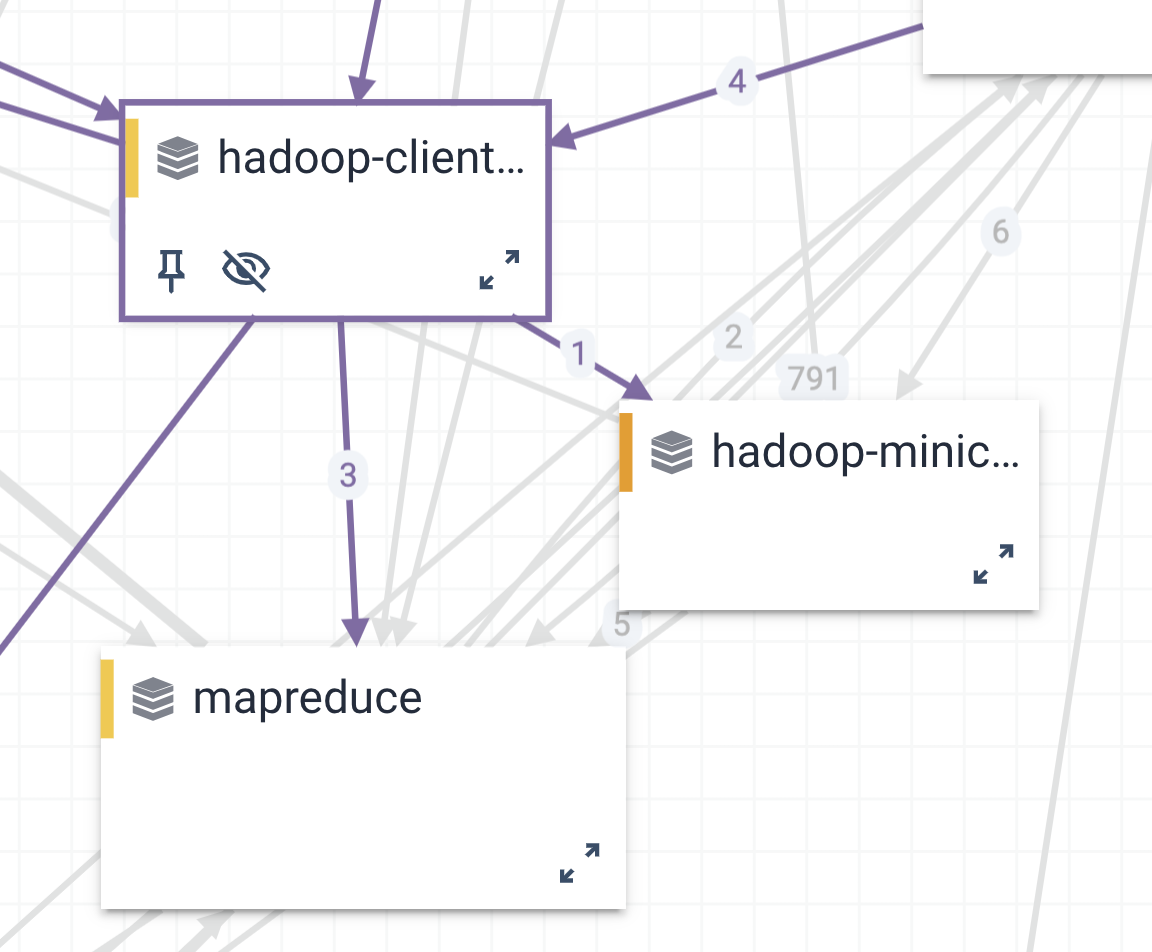
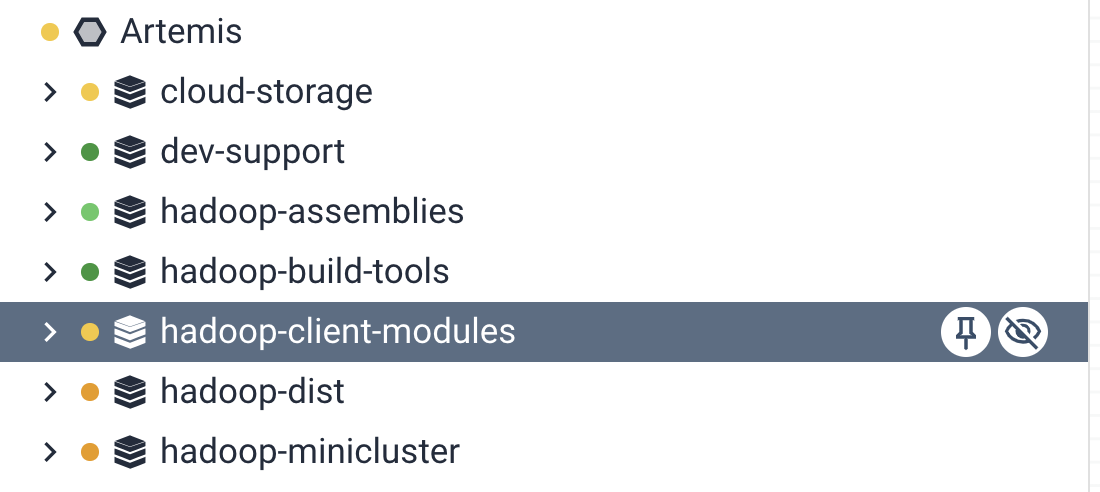
- Component’s can also be pinned and hidden (or unpinned and unhidden) from the tree view. Hovering over a component name within the tree view will also cause the pin and hide toggles to appear to the right of the name.
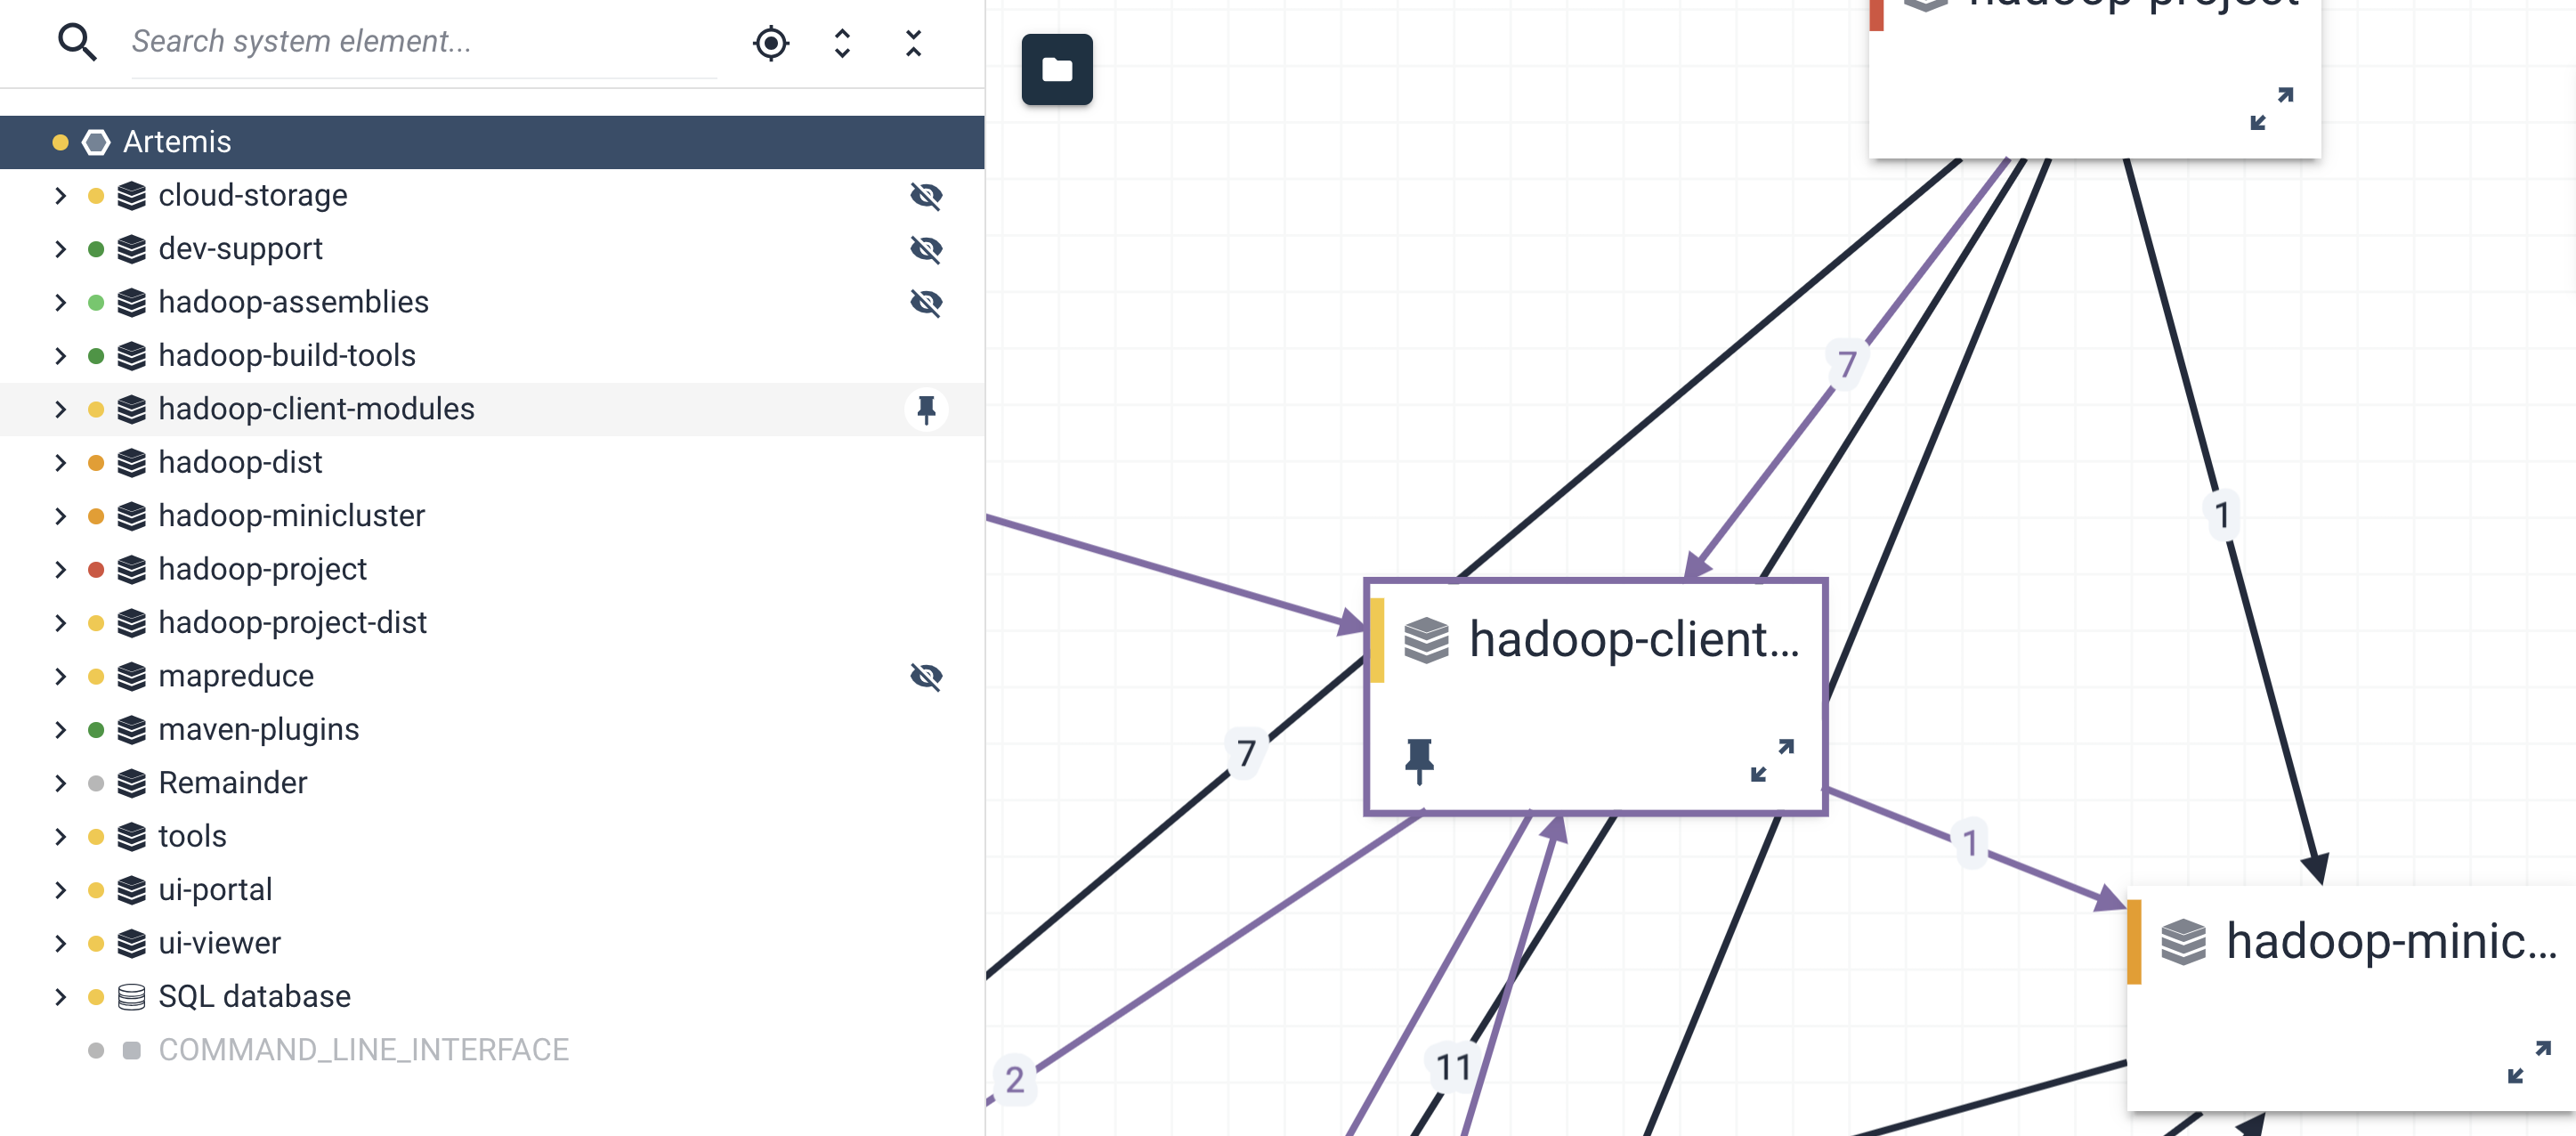
Once the pin or hide icon has been toggled, these icons will remain visible in both the canvas and tree view to help easily identify which components have had their visibility modified and toggle this off as needed by clicking the shown icon again.
Highlighting undesirable dependencies
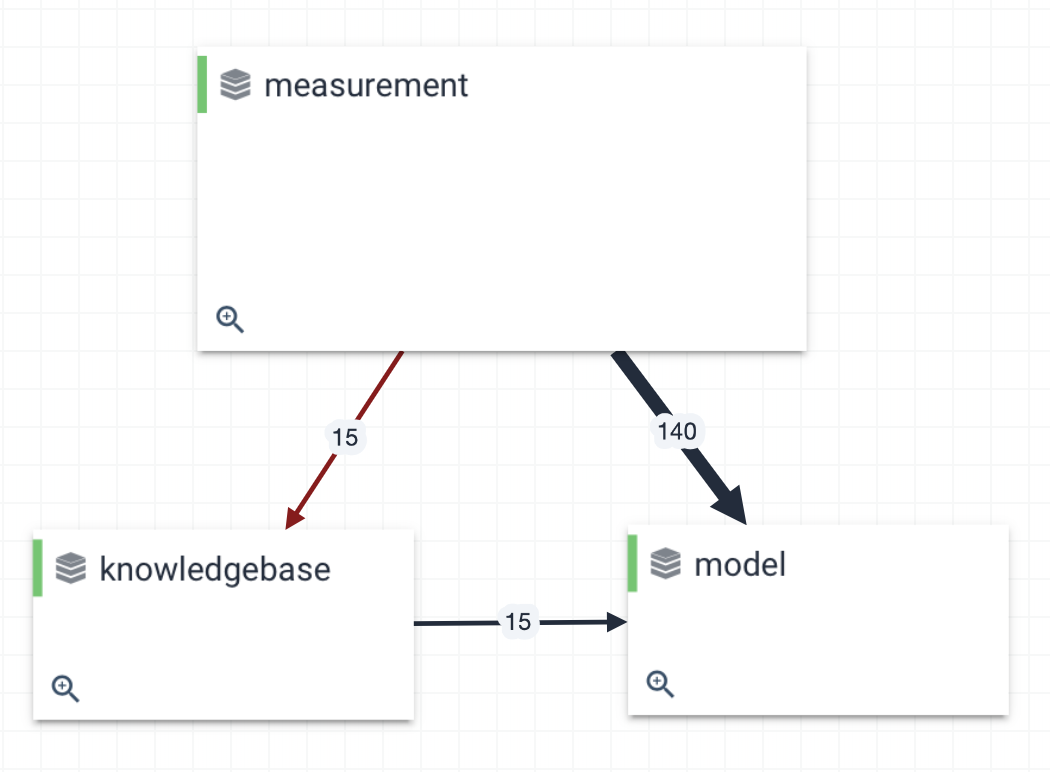
You might have noticed that some dependencies are shown in red. These dependencies are considered undesirable, either because they violate a known architectural anti-pattern (for example cyclic dependencies), or because they have been marked as undesirable in your configuration.
Grouping and annotating components
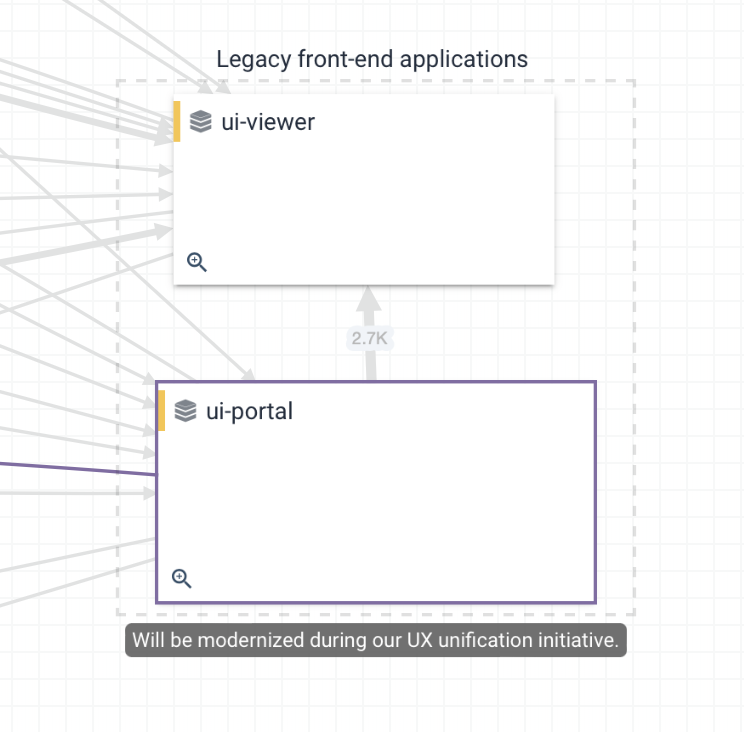
In some cases, you might want to communicate additional information through Sigrid’s architecture view. Such information does not directly originate from the source code, but adds some context that makes the architecture easier to find and interpret.
You can define groups and annotations in your configuration. This information will then be depicted as an overlay on top of the architecture visualization in Sigrid.
Saving architectural views
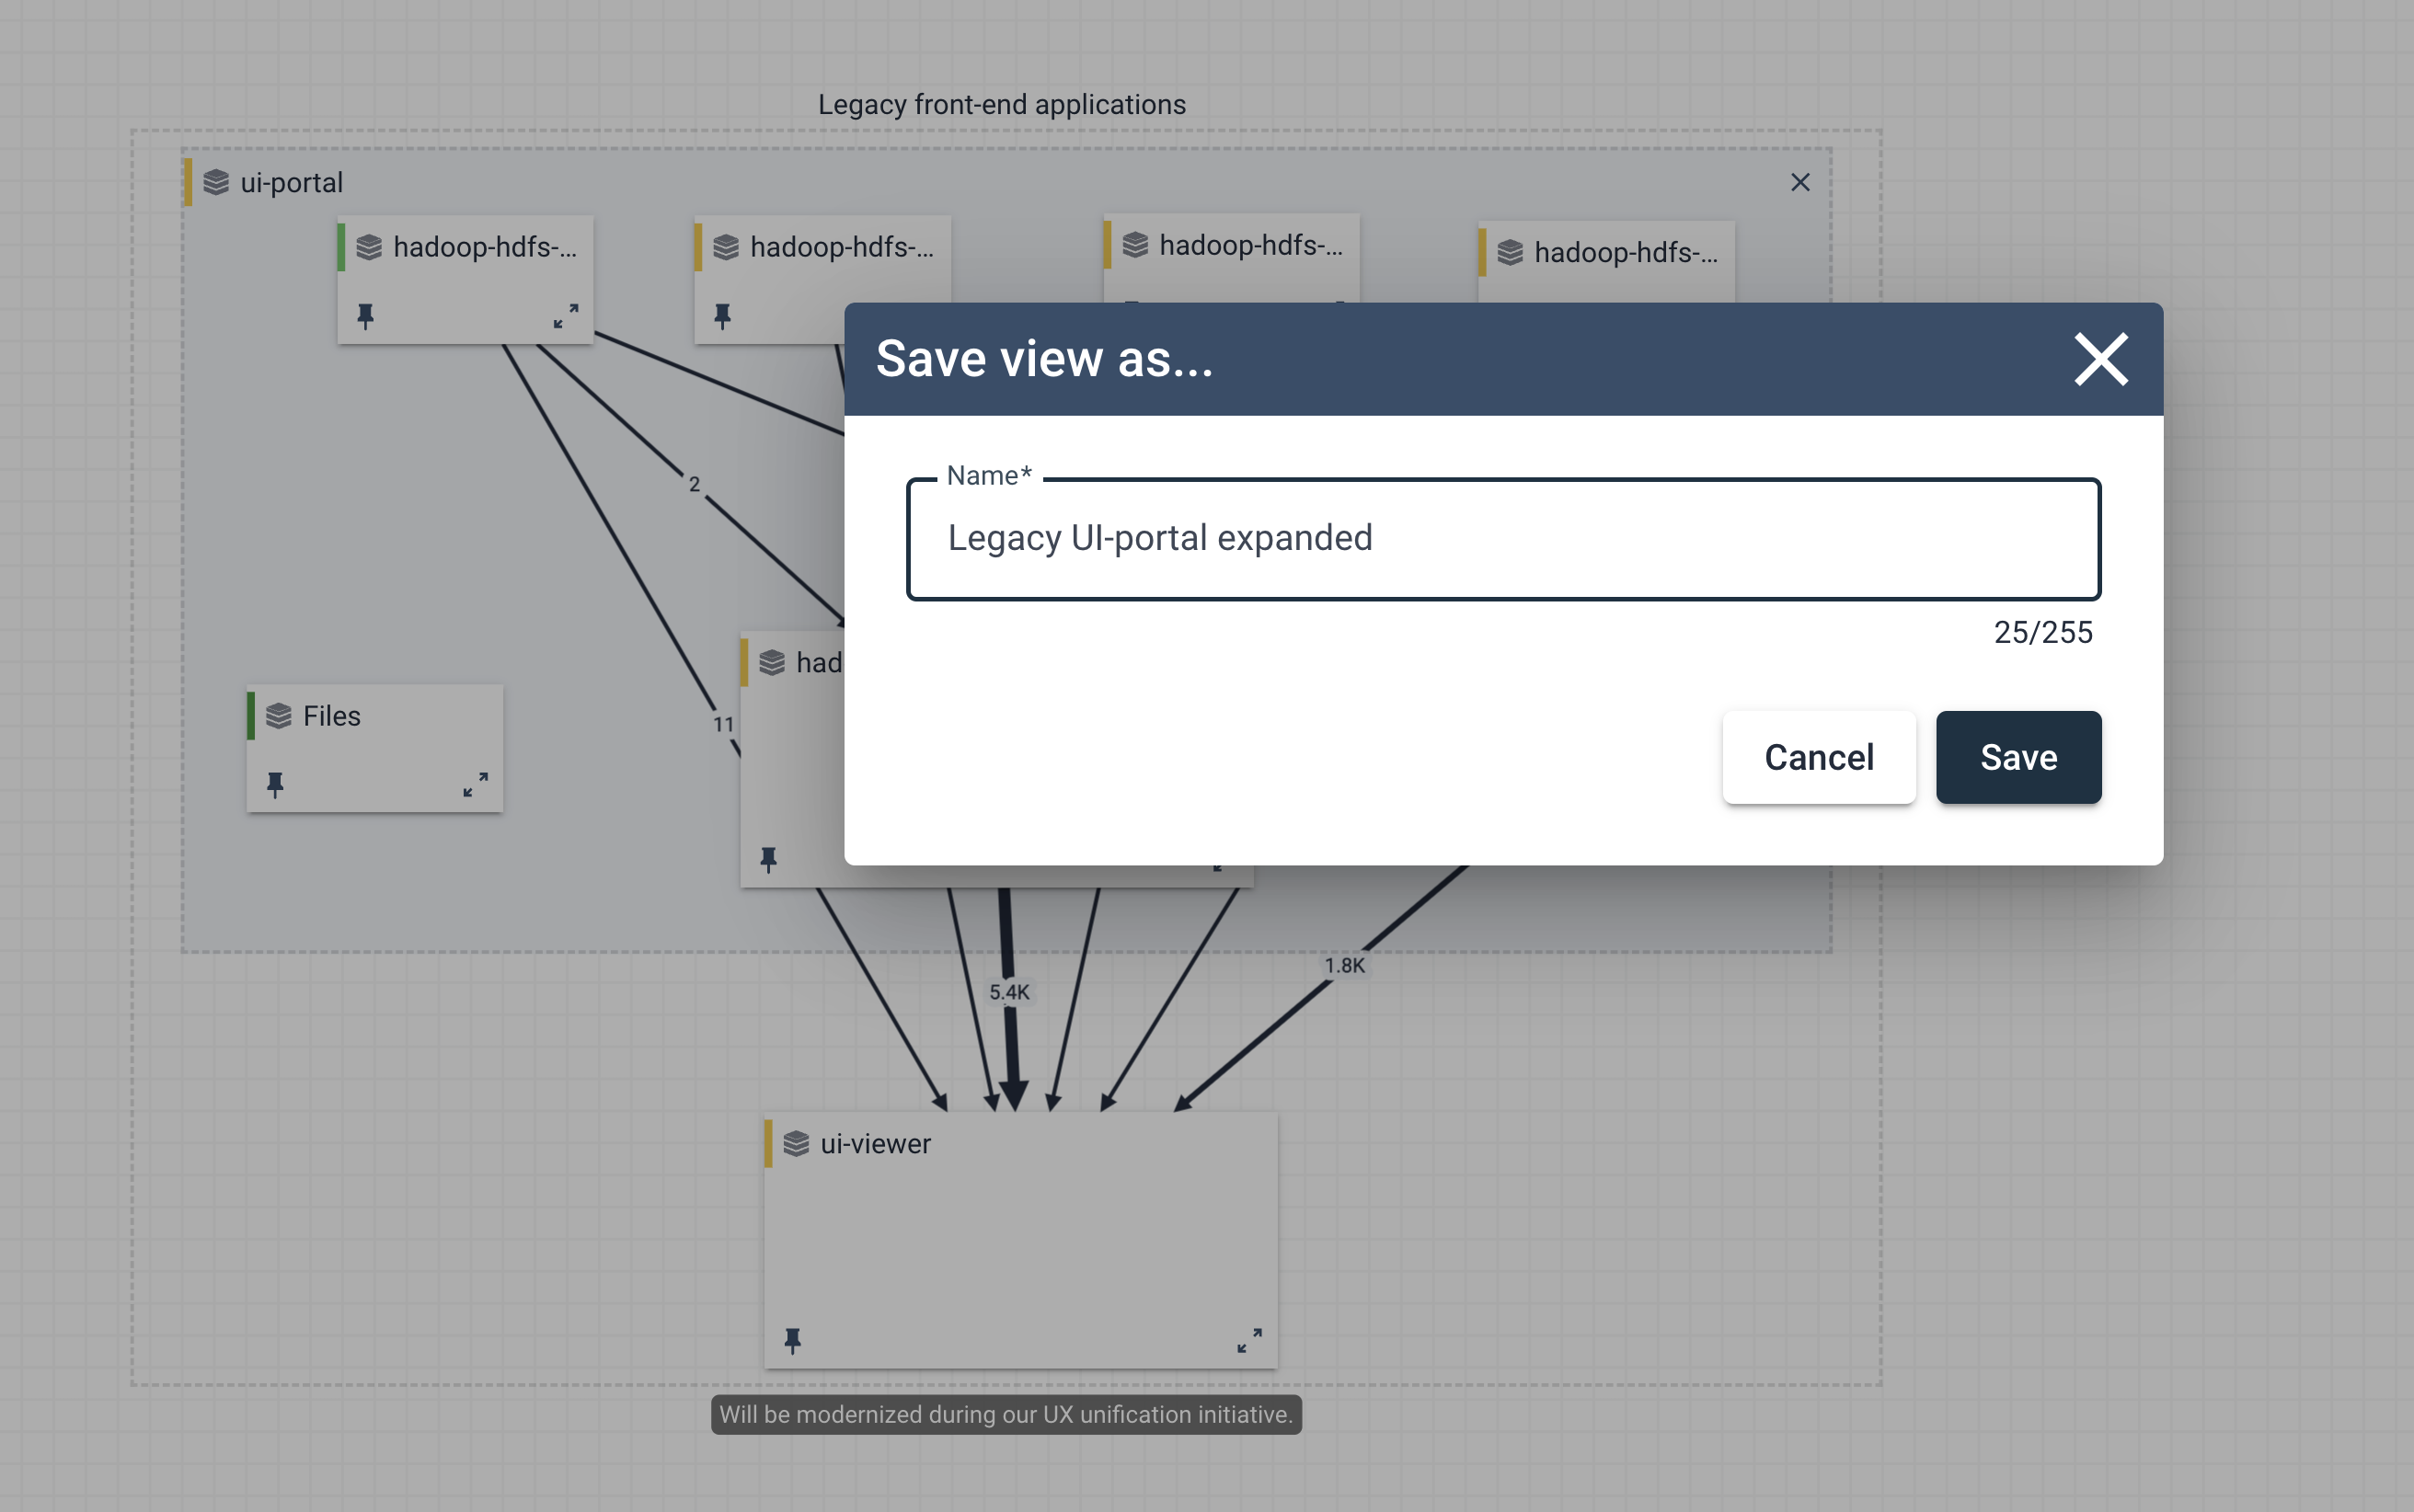
It is possible for users to create and save specific views from the architecture explorer for later review or documentation purposes. When creating a new view, all elements currently displayed on within the explorer view are saved in their current state, at their current level within the architecture.
This means that any components that have been expanded, hidden or pinned will be stored “as displayed” and will be able to be retrieved and re-rendered from the Saved Views panel. Having the ability to save specific configurations of the canvas will allow teams to quickly access the dependencies between components or sub-components of highest interest and share these views across team members to get a more consistent perspective of your system’s architecture at any level you deem important.
Accessing saved views is easily done through the architecture explorer, where we’ve introduced a simple button that toggles a new panel to appear with an inventory of any saved views that exist for a given system.

In order to create a new saved view, you must first open the “Open Saved Views Panel” button on the right side of the canvas explorer, which expands the Saved Views Panel over the existing Details Panel. From here, users can select from one of the existing saved views to render within the explorer canvas, or click the “Save current view” button at the top to save the current architecture configuration rendered in the explorer.
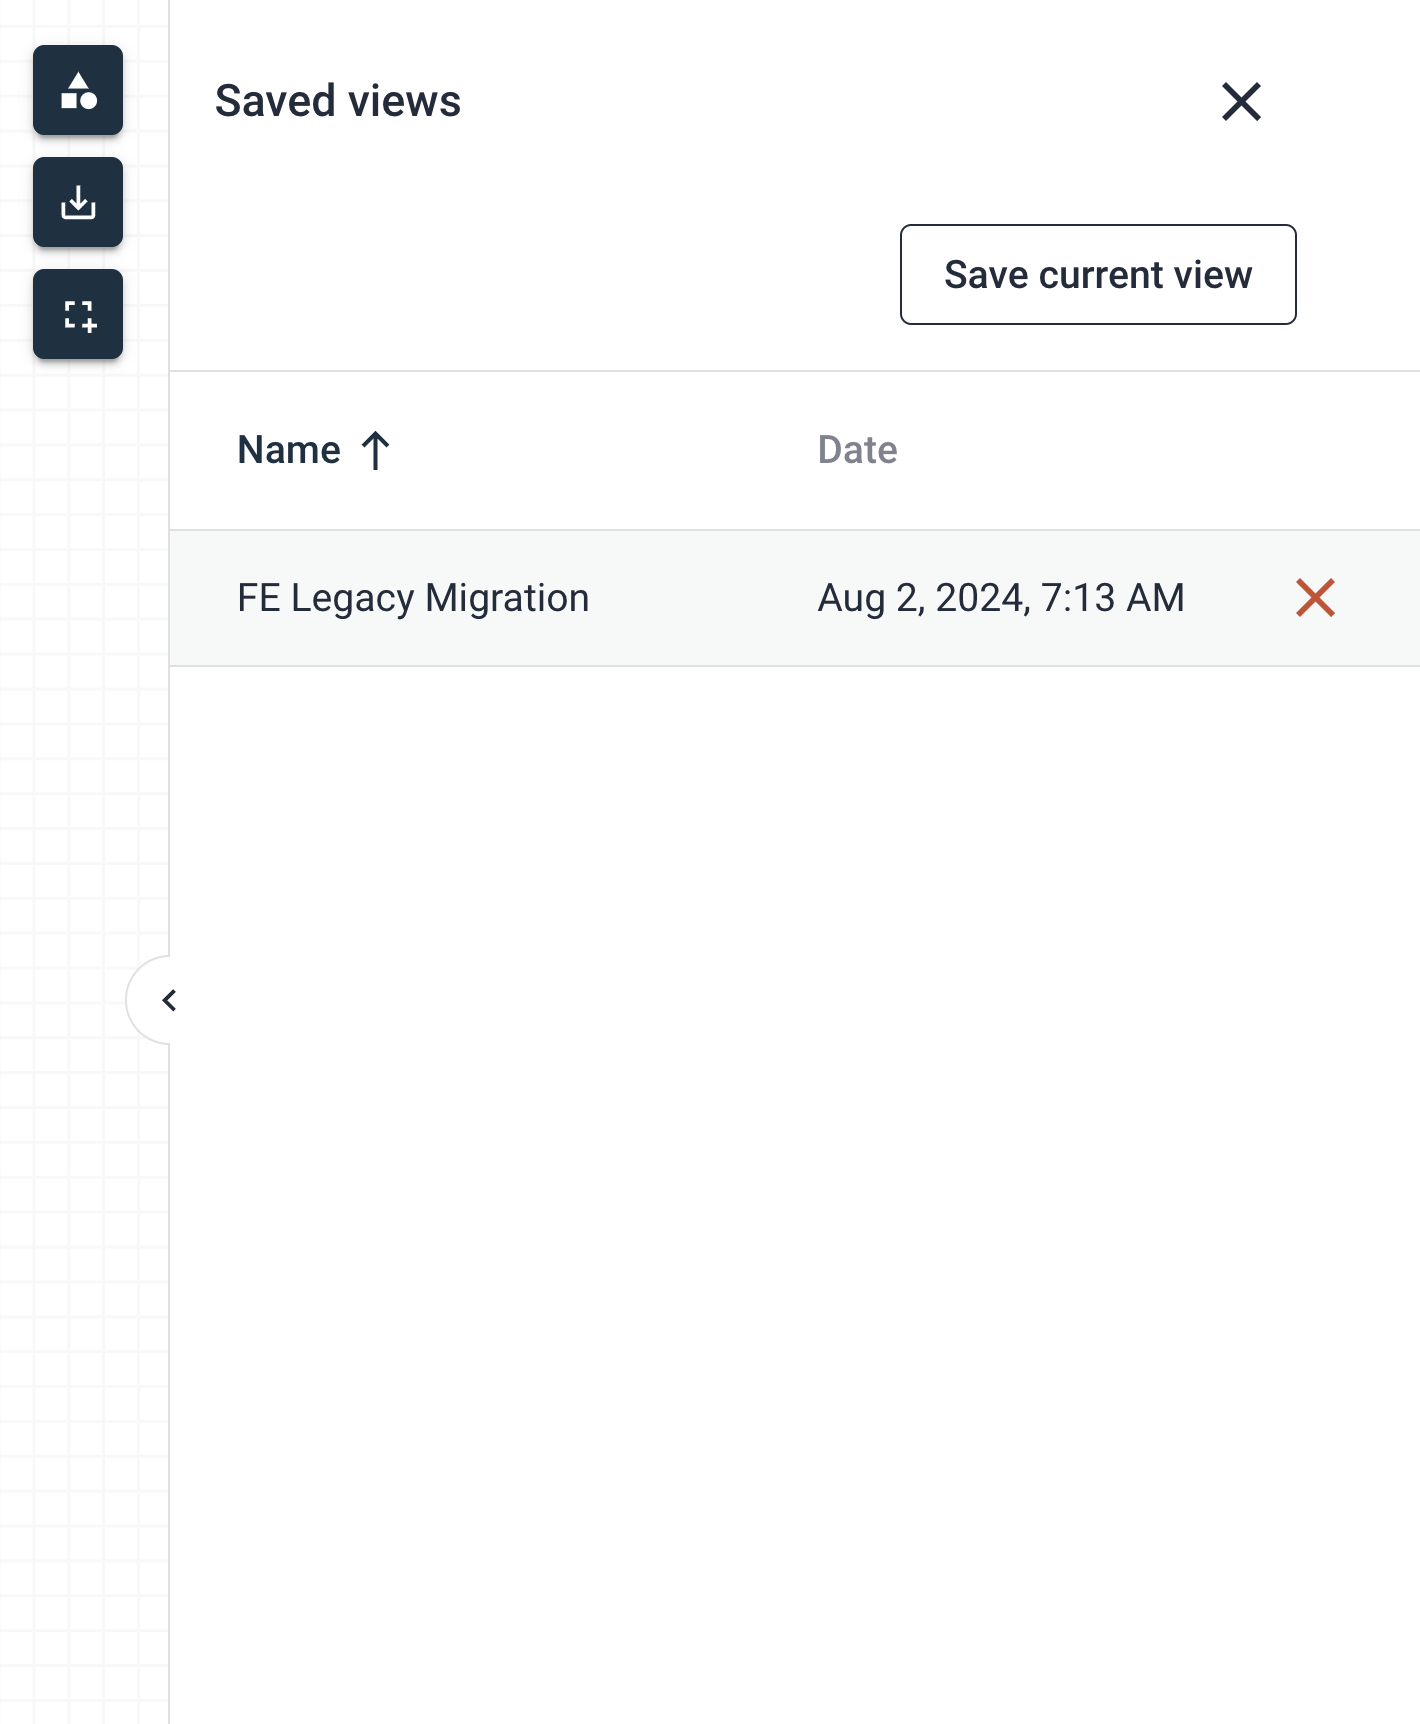
When clicking on the “Save current view” button, you will be prompted to give a name to the configuration currently displayed in the architecture canvas, so picking a descriptive name other than the default is highly recommended.
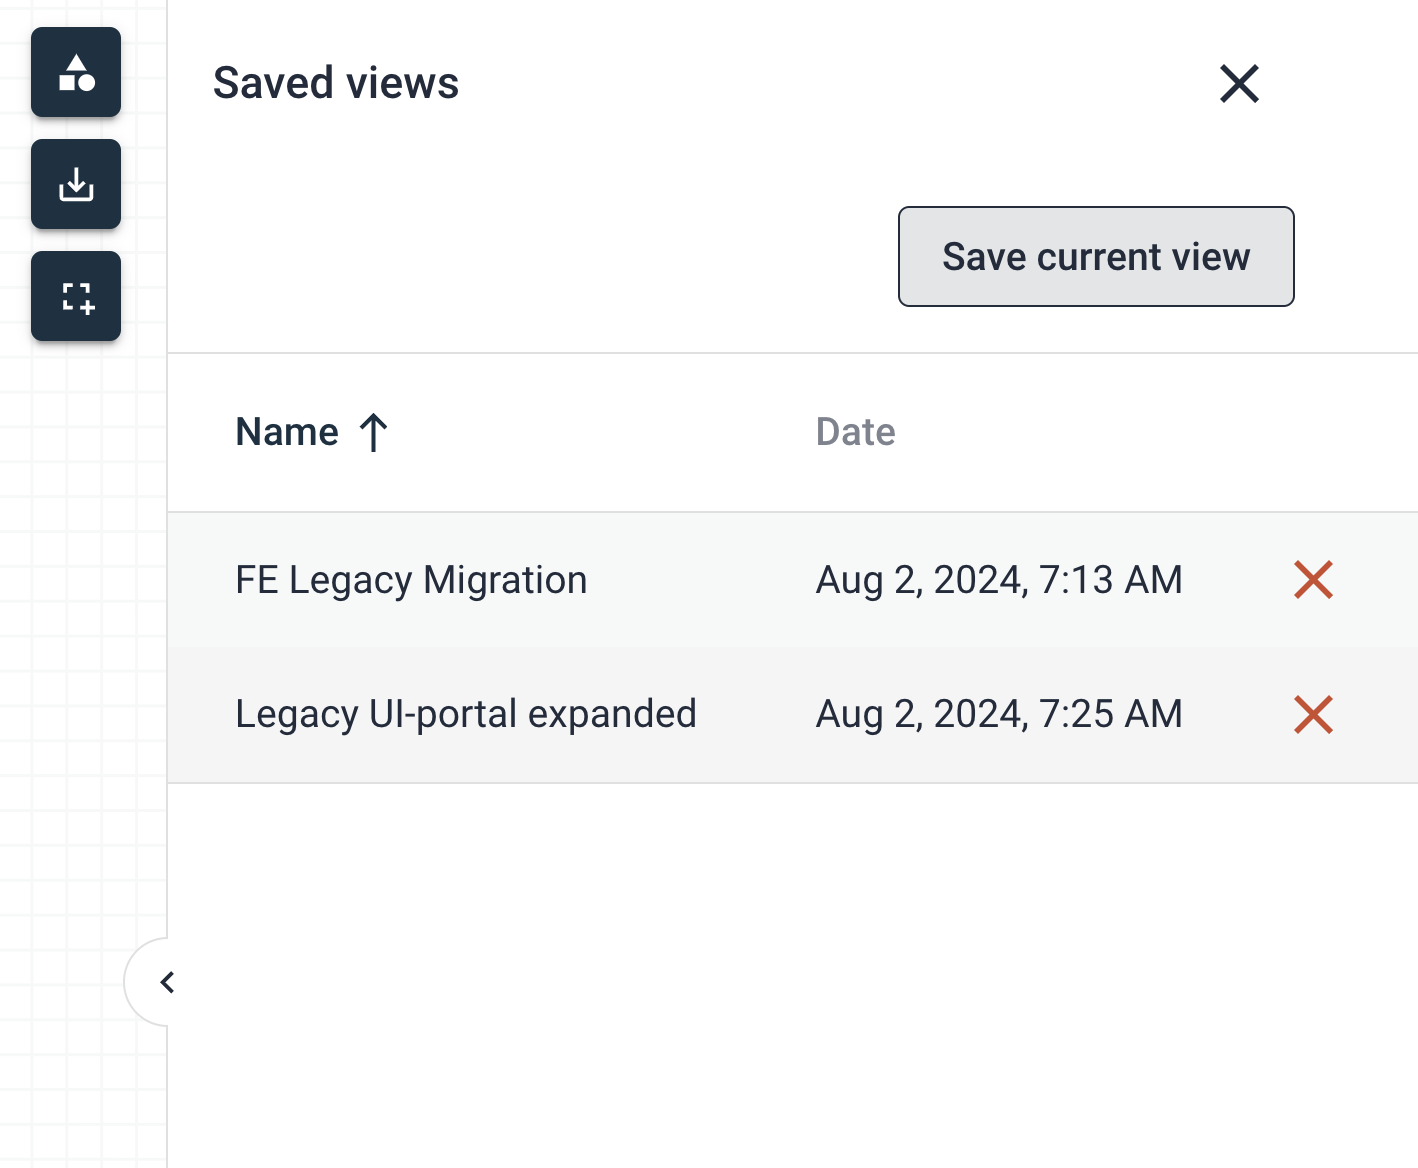
Upon saving, a new entry will be added to the Saved Views list with the specified name, date and time of the views creation. This newly created architectureal view along with any additional pre-existing views are accessible to all users that are authorized to access this system.
Important things to note about saved views:
- A maximum of 10 Views are able to be saved per system
- Saved Views are tied to the system, not the user - any user with access to the system can select and render any saved view existing for a given system.
Labeling components to communicate their role in the architecture
You can now assign roles to components within your system that allow Sigrid to better reflect their usage and intention in the evaluation of your architecture. Roles assigned to a component can affect how the measurement model evaluates star-ratings or visualize the component in order to better reflect intentional design decisions made by the engineering team that are deemed an acceptable risk that Sigrid can ignore.
Labeling Components as Utility Components
At the moment, we have a single role users can designate a component as, a Utility.
There are many cases where design decisions result in higher-than-average coupling to centralized abstractions (interfaces) or even discrete code (libraries, utils), but from the engineering team’s perspective this is intentional and can be deemed acceptable and preferred. The Utility role attempts to reflect this by allowing expected coupling to be deemed as acceptable and not influence the overall rating.
You can define component roles in the configuration.
NOTE: This label is inherited by all child artifacts/sub-components found within the specified parent component.
Labeling a component as Utility has the following affects:
- Components (and their child/sub-components!) marked as
Utilitywill not be evaluated for Component Coupling and Component Adjacency. - These properties are marked as N/A and will no longer affect the overall AQ score – remaining properties are unchanged
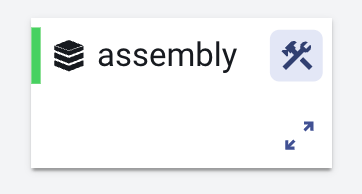
Utilitycomponents are visualized in the Sigrid interface with specific UI indicators for ease of tracking. All dependencies remain shown, only the property star-ratings are not evaluated.
Frequently asked questions
See Architecture Quality: frequently asked questions for more detailed information on operational details regarding Architecture Quality. This includes questions regarding uploading code, technology support, and configuration.
Contact and support
Feel free to contact SIG’s support team for any questions or issues you may have after reading this documentation or when using Sigrid.

