The Code Explorer
For a general approach analyzing maintainability metrics, see the section for investigating system maintainability rating state and -changes. Using the Code Explorer is also discussed on our page on the agile development process.
Use the Code Explorer if you suspect specific maintenance hotspots and want to understand the details The Code Explorer view lets you explore a system’s codebase and maintainability findings that are associated with it. It is visible by default for all systems.
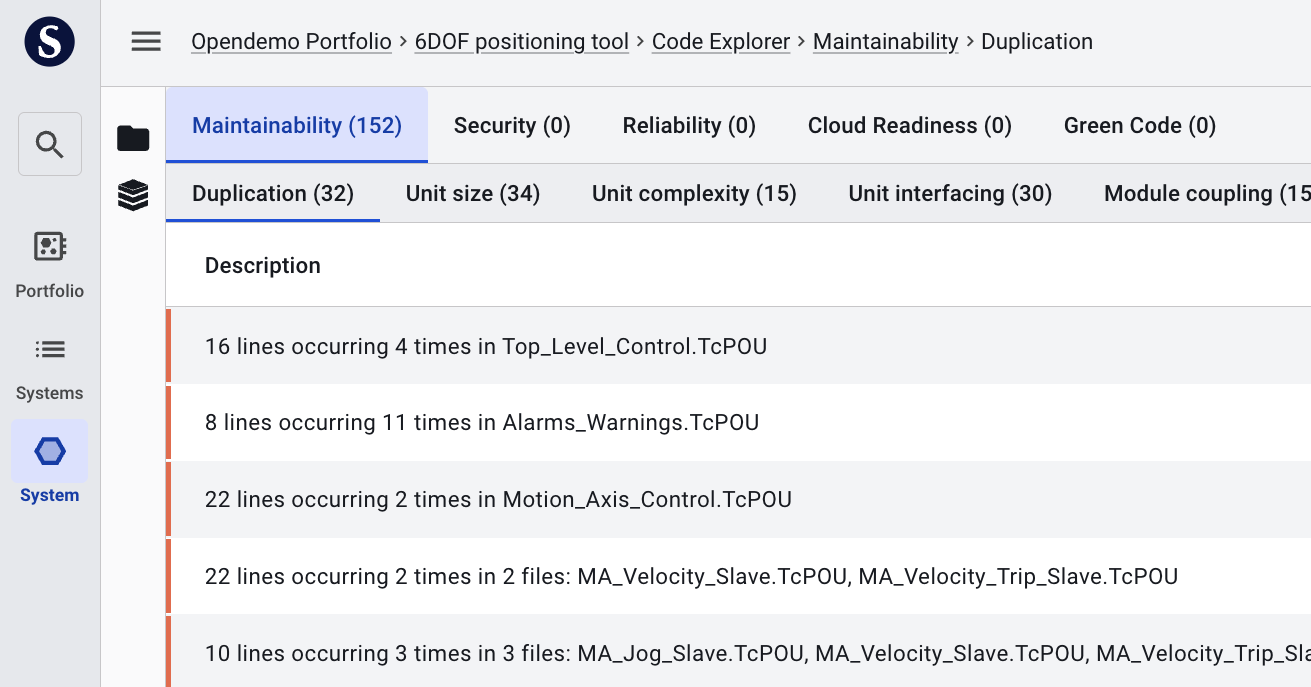
In a way, it is the reverse of all the finding views, such as maintainability and security. There you start with lists of findings, ordered by the findings’ severity. Then you can investigate where they occur in the code. So these views answer different questions: “Where are my highest quality risks in the code?” (Findings and Maintainability tabs) or “Given a certain file, what are all the risks that could be assessed/refactored?” (Code Explorer).
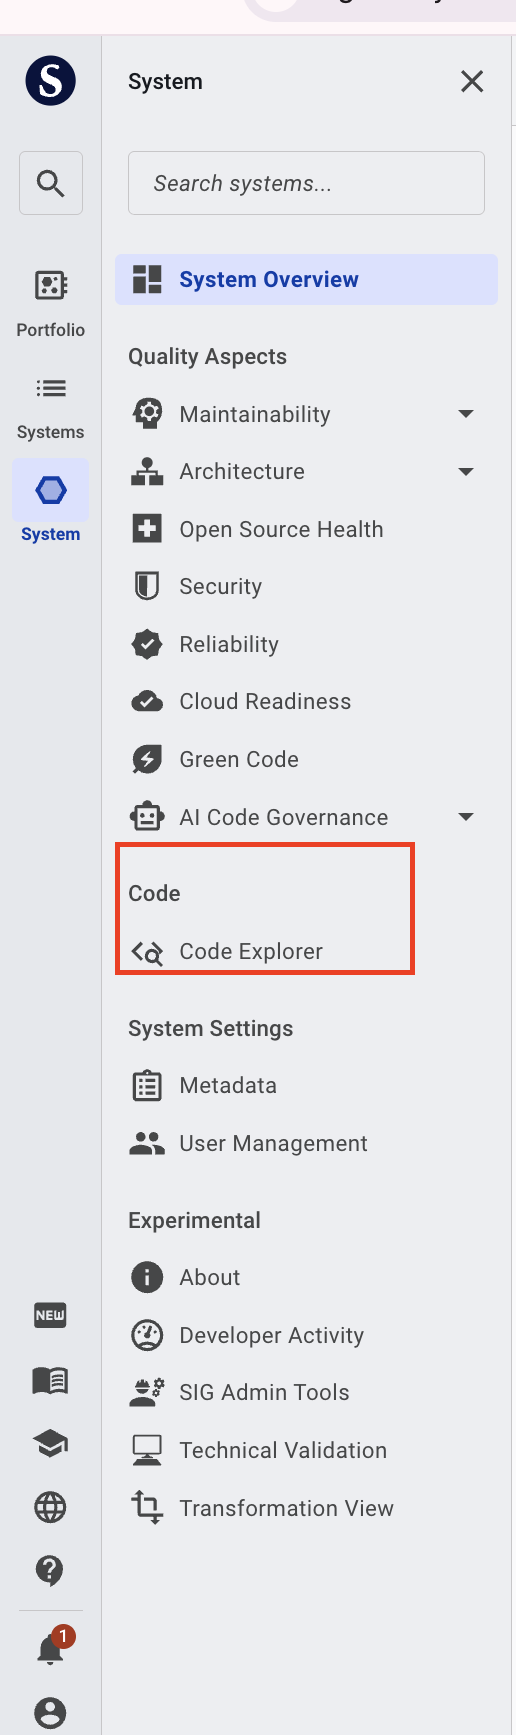
You can reach this view in different ways: Via the top menu, or clicking an a capability on the System or Portfolio Overview pages. See the system-level Overview page or portfolio-level Overview page. Also, you may be referred to the Code Explorer page by clicking its icon when you are in system level.
Customizing your view with collapsible panels
To reduce clutter and let you focus on what matters most for your workflow, Code Explorer’s panels can be toggled on and off.
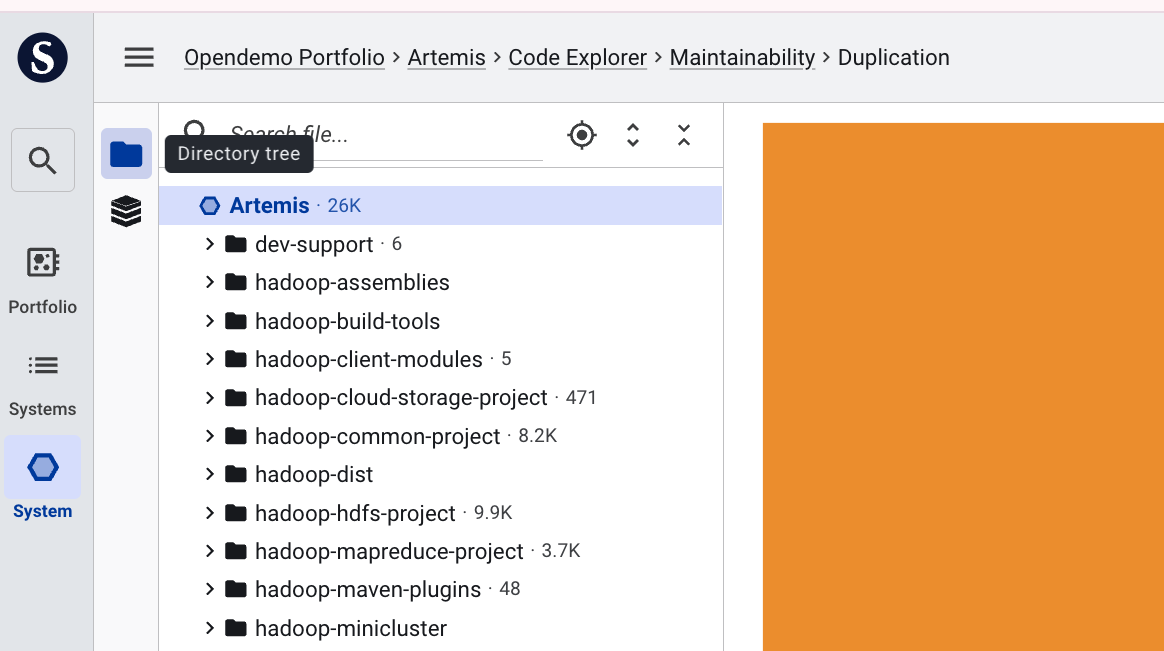
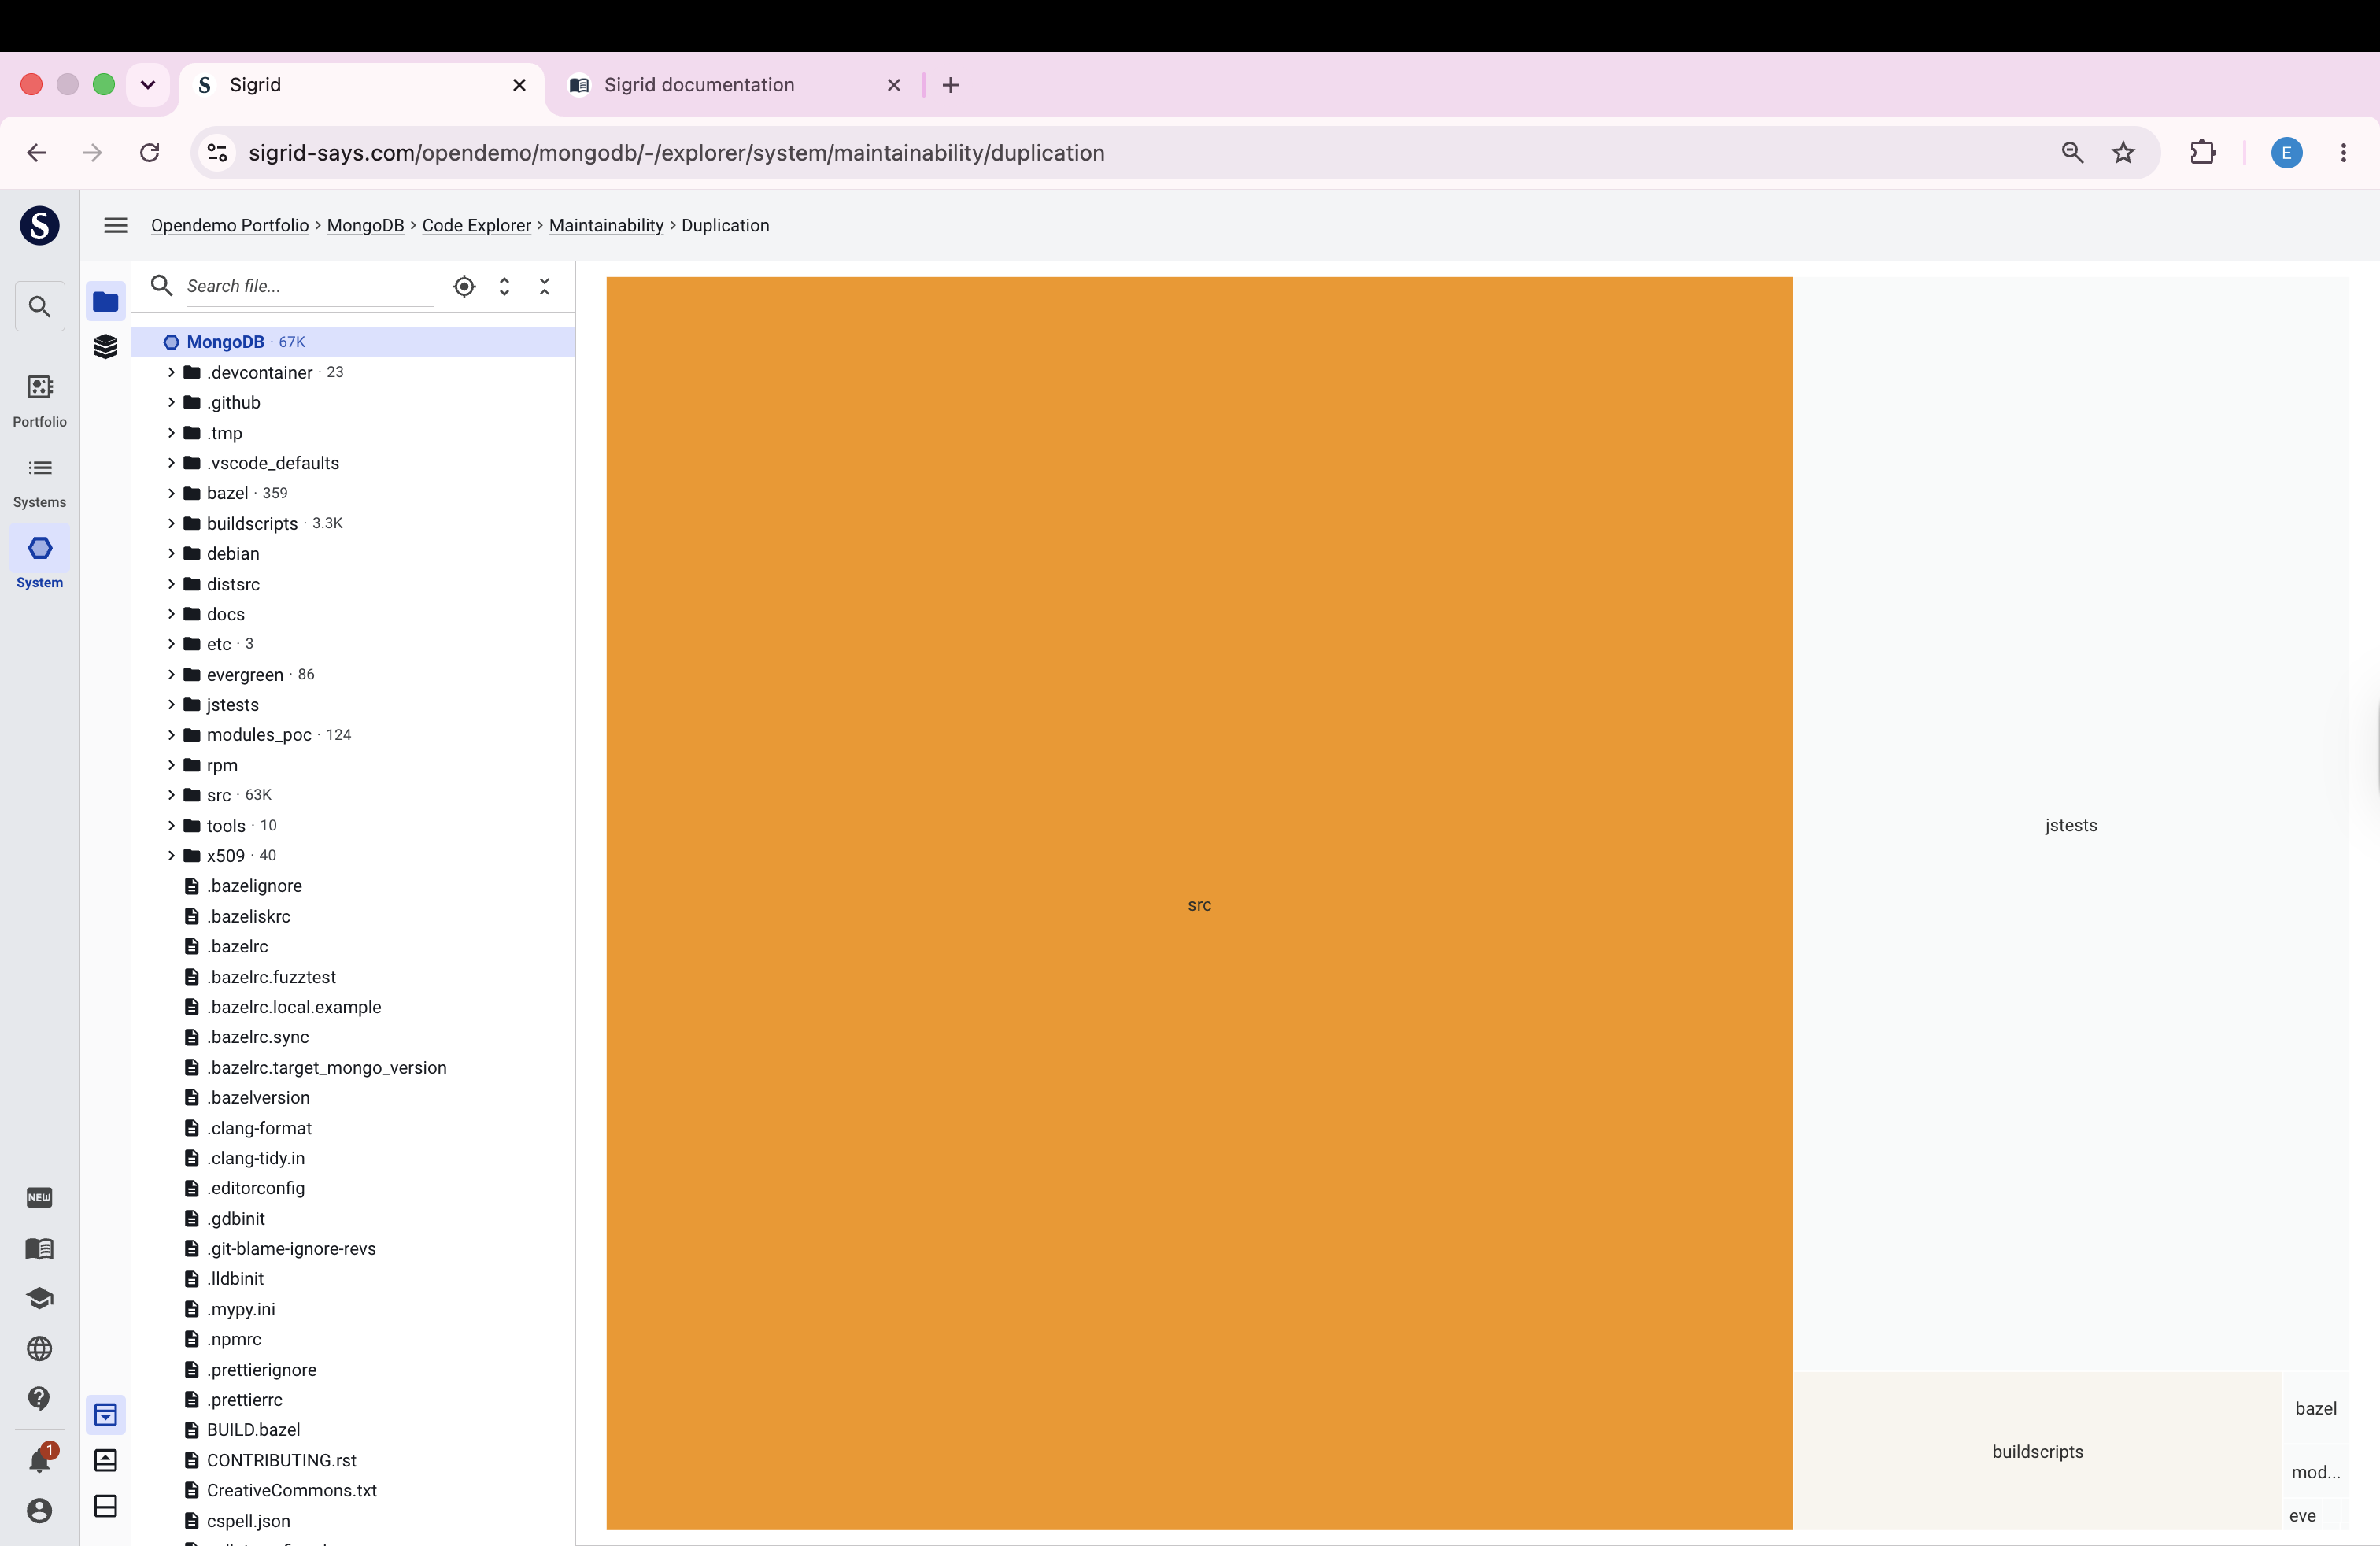
Directory tree / Components panel (left)
Use the icon buttons in the left sidebar to switch between or hide the directory tree and component view. Clicking an icon opens that panel; clicking it again closes it, giving the remaining panels more space.
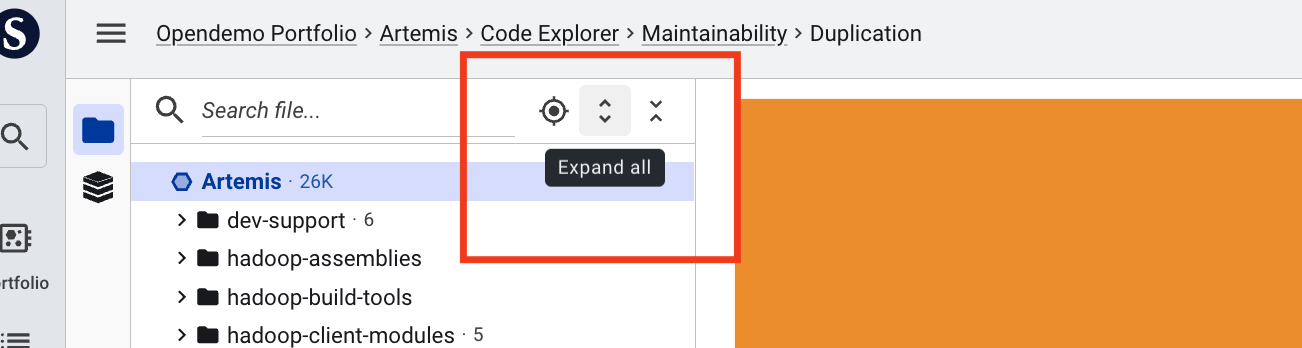
You can also expand or collapse every node in the tree at once:
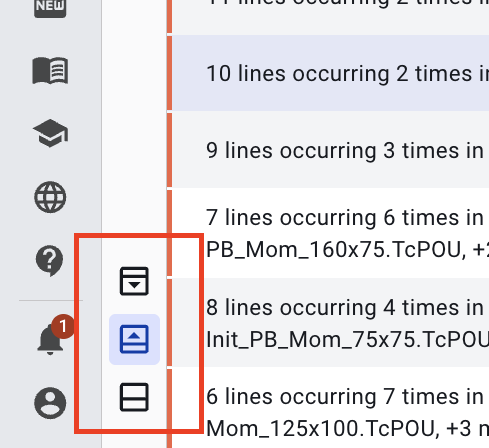
Source code and findings list (top/bottom)
You can choose to view both the source code and findings list together (default), only the source code for a focused view when analyzing a specific file, or only the findings list for a focused view when prioritizing and triaging findings.
When viewing a specific finding’s details, the source code panel always remains visible, so you never lose the context of the code related to that finding.
Different views: directory or component structure
The default view lets you choose between a directory structure. It represents the structure as the source is unpacked at our (SIG’s) side.
The directory view and component view in most cases are (almost) the same. This can be a matter of how the system is defined or scoped. Scoping choices may allow for specific filtering and componentization, e.g. a component division that does not follow the directory structure or when you are working with multiple repositories. For details on scoping, see the scope configuration page.
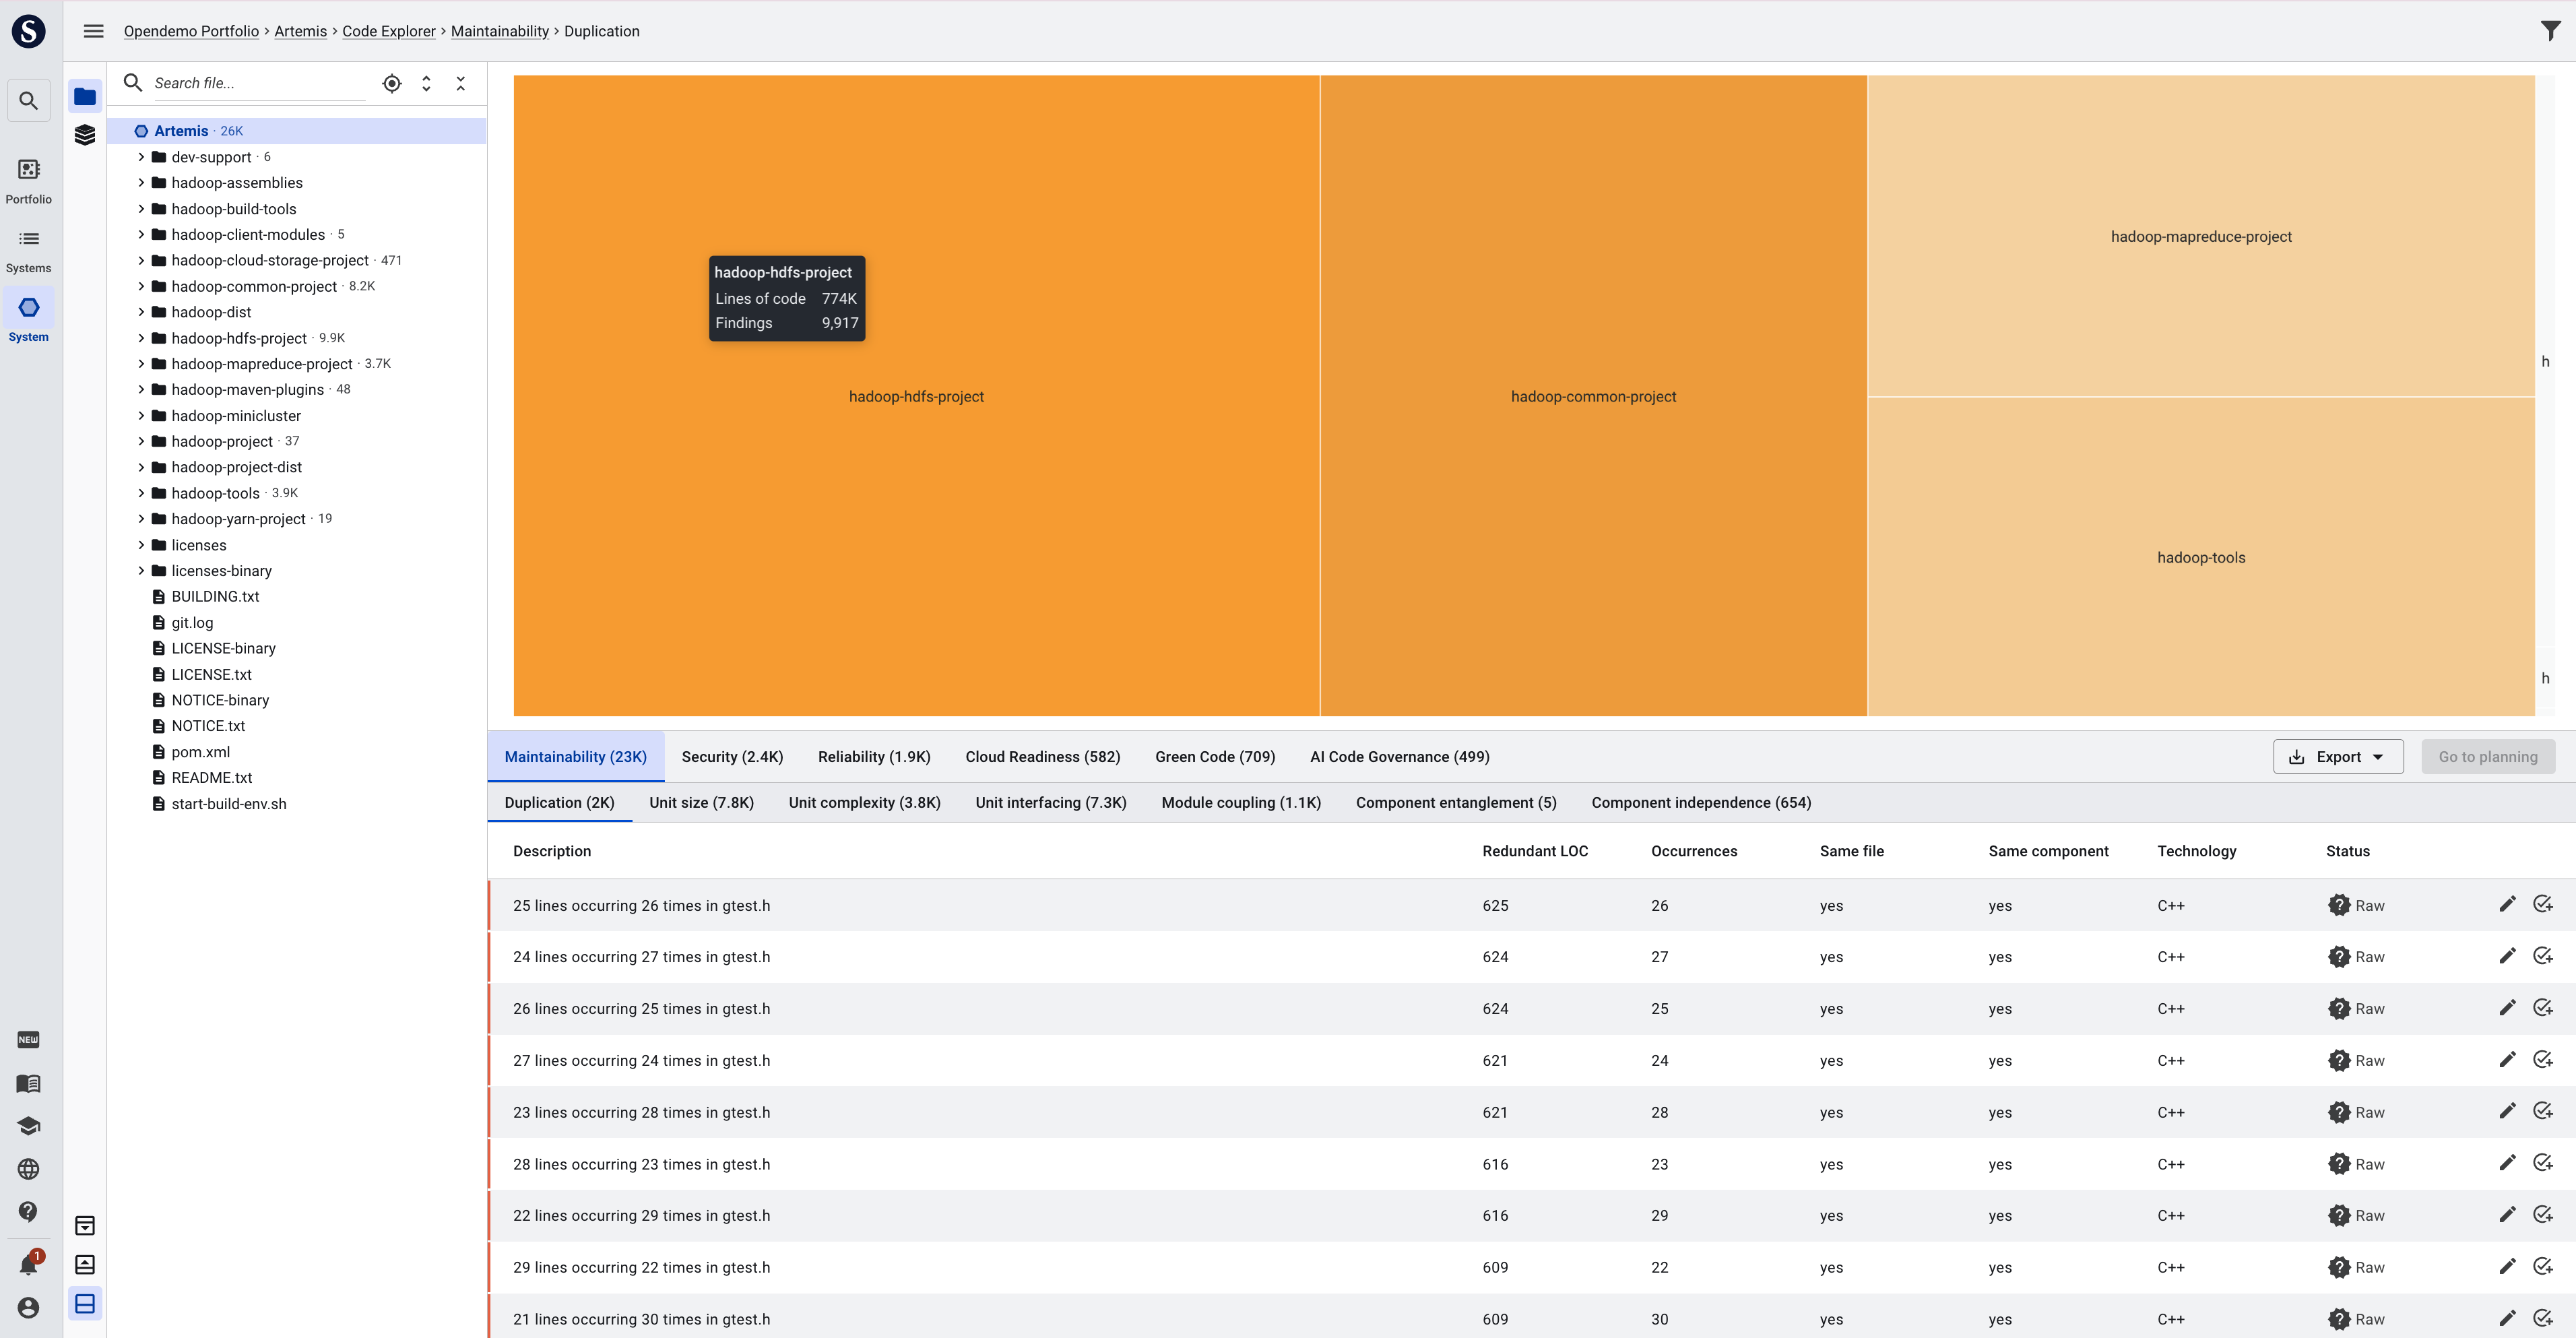
Navigating a directory or component in the Code Explorer
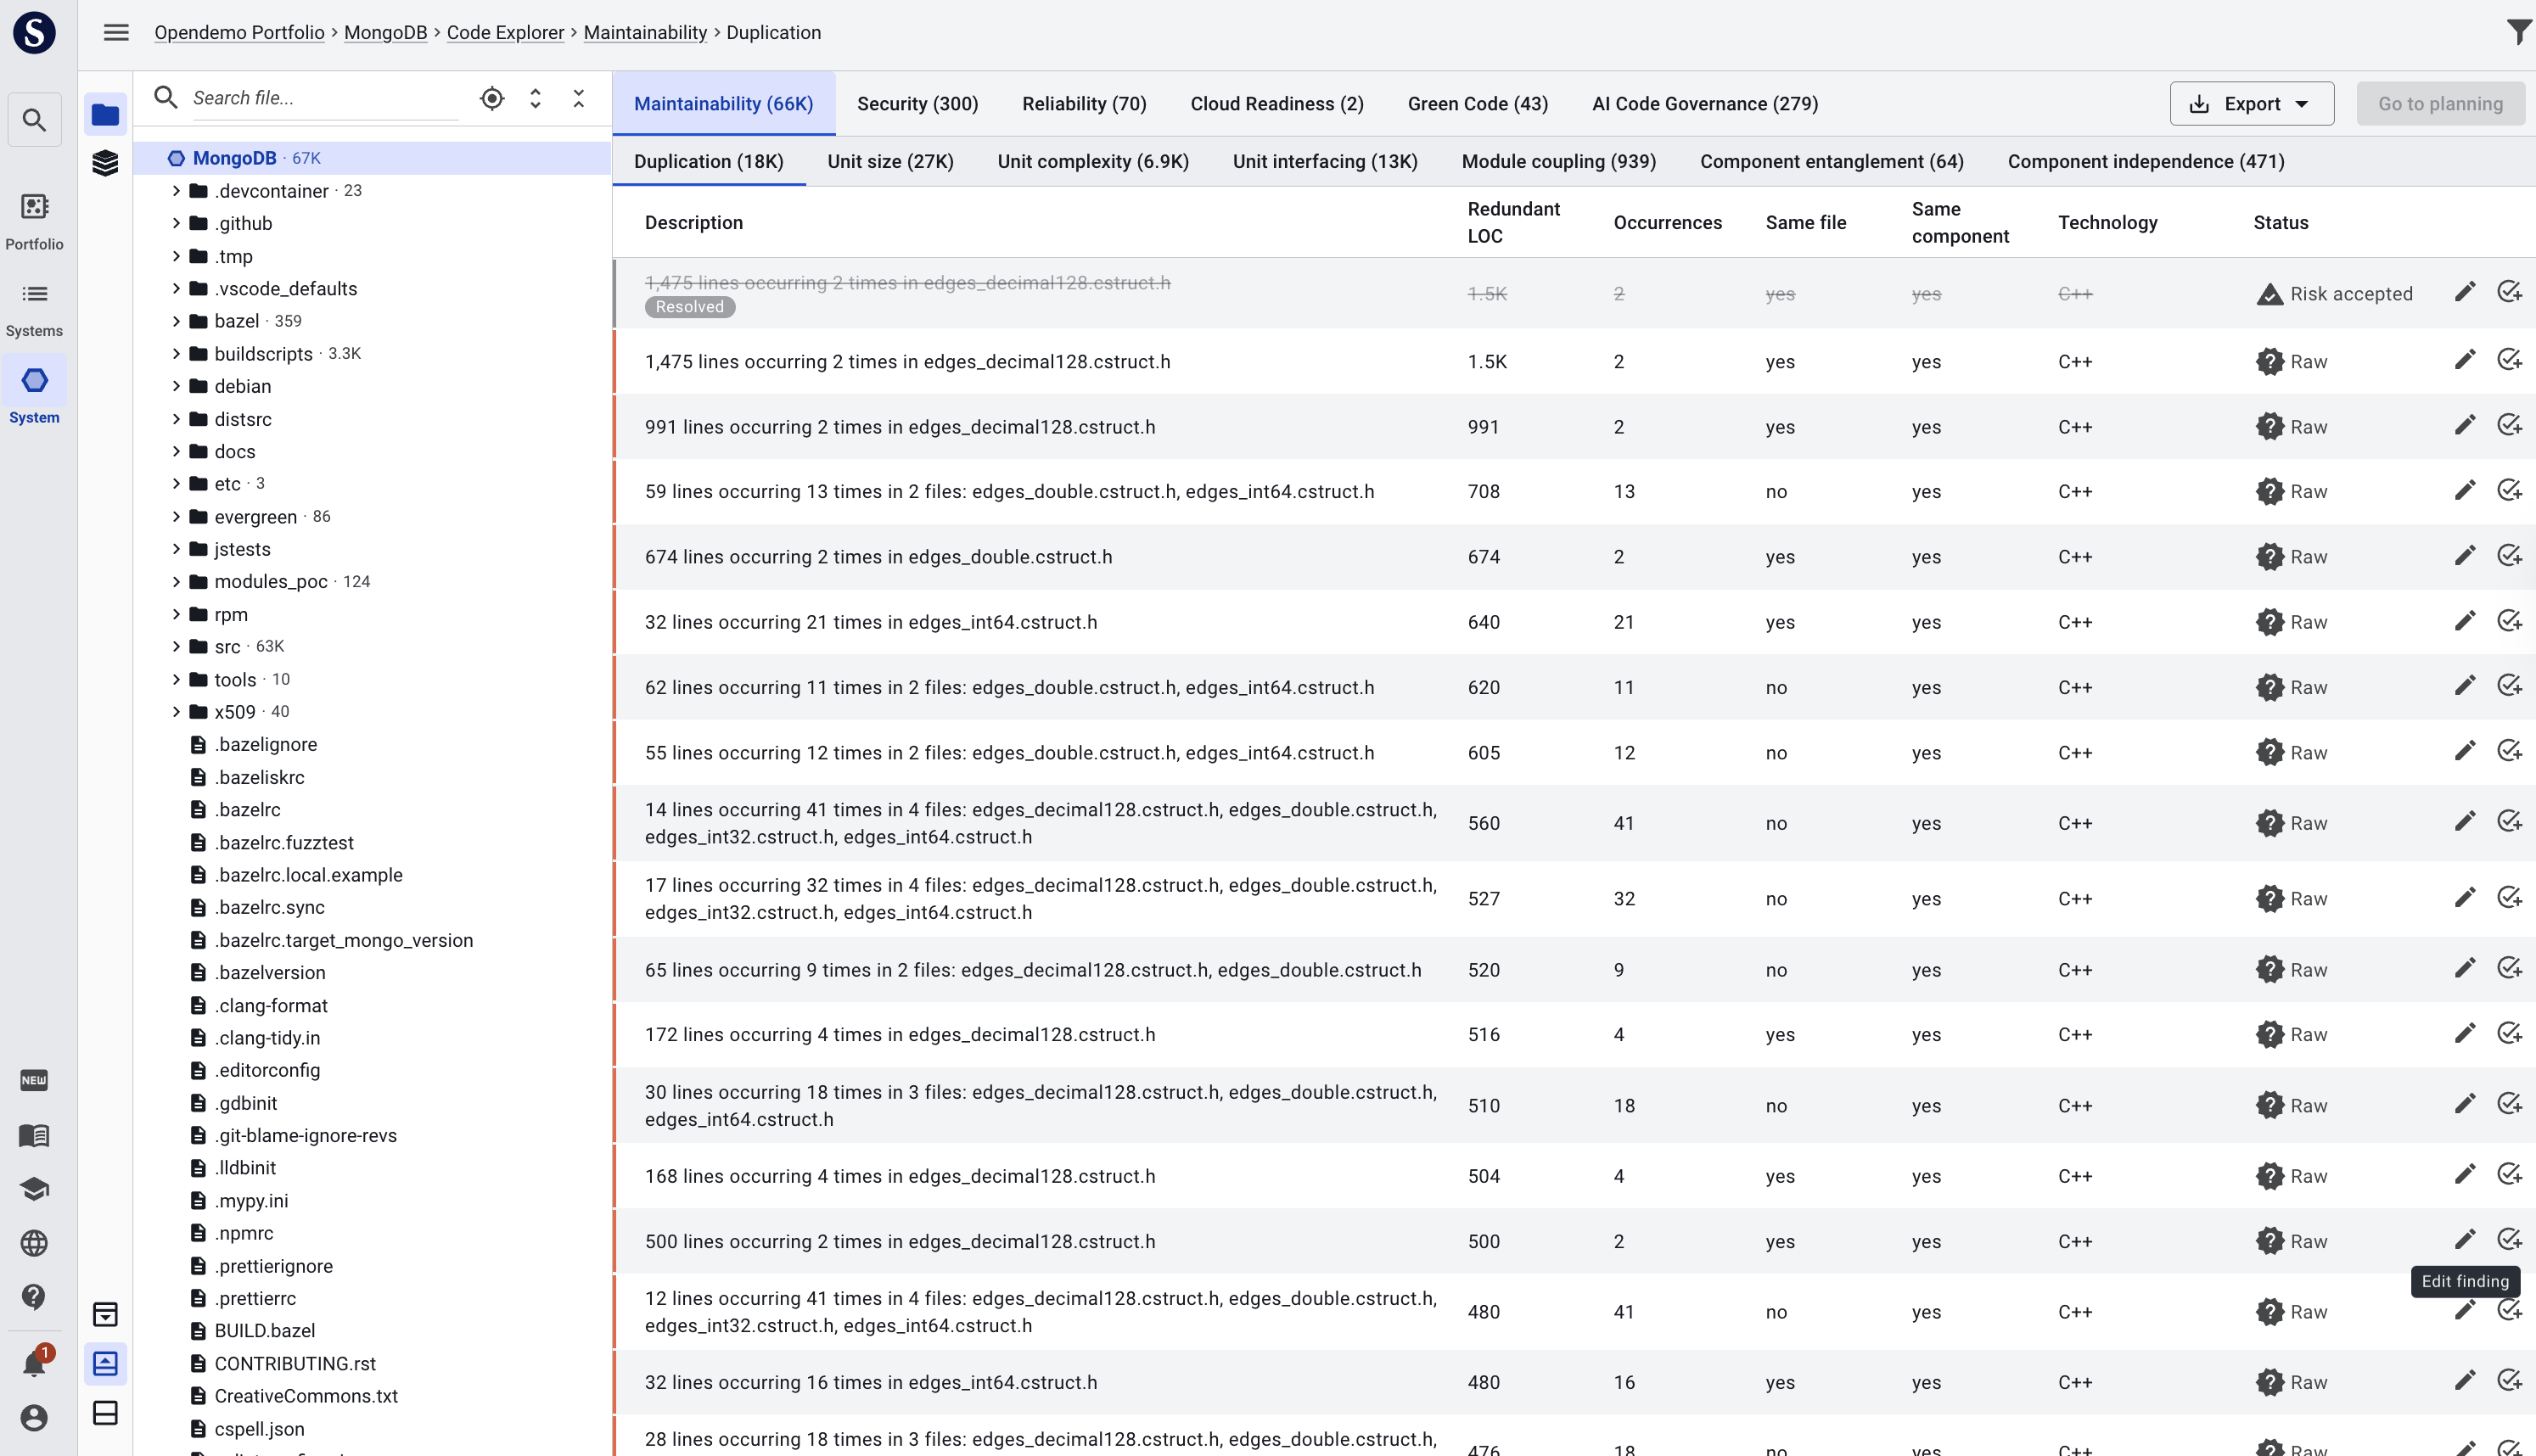
Clicking on a directory or component will make 2 panels appear to the right: sources (on top) and findings (on bottom). The panels will change dynamically, depending on e.g. which file and finding you select. By default, a treemap represents the collection of files. The size of the squares/quadrilaterals represents code volume. A mouseover on a file shows volume- and finding counts. In the lower right panel, Maintainability and its metric Duplication are shown by default. They can be changed according to interest.
Navigating a file in the Code Explorer
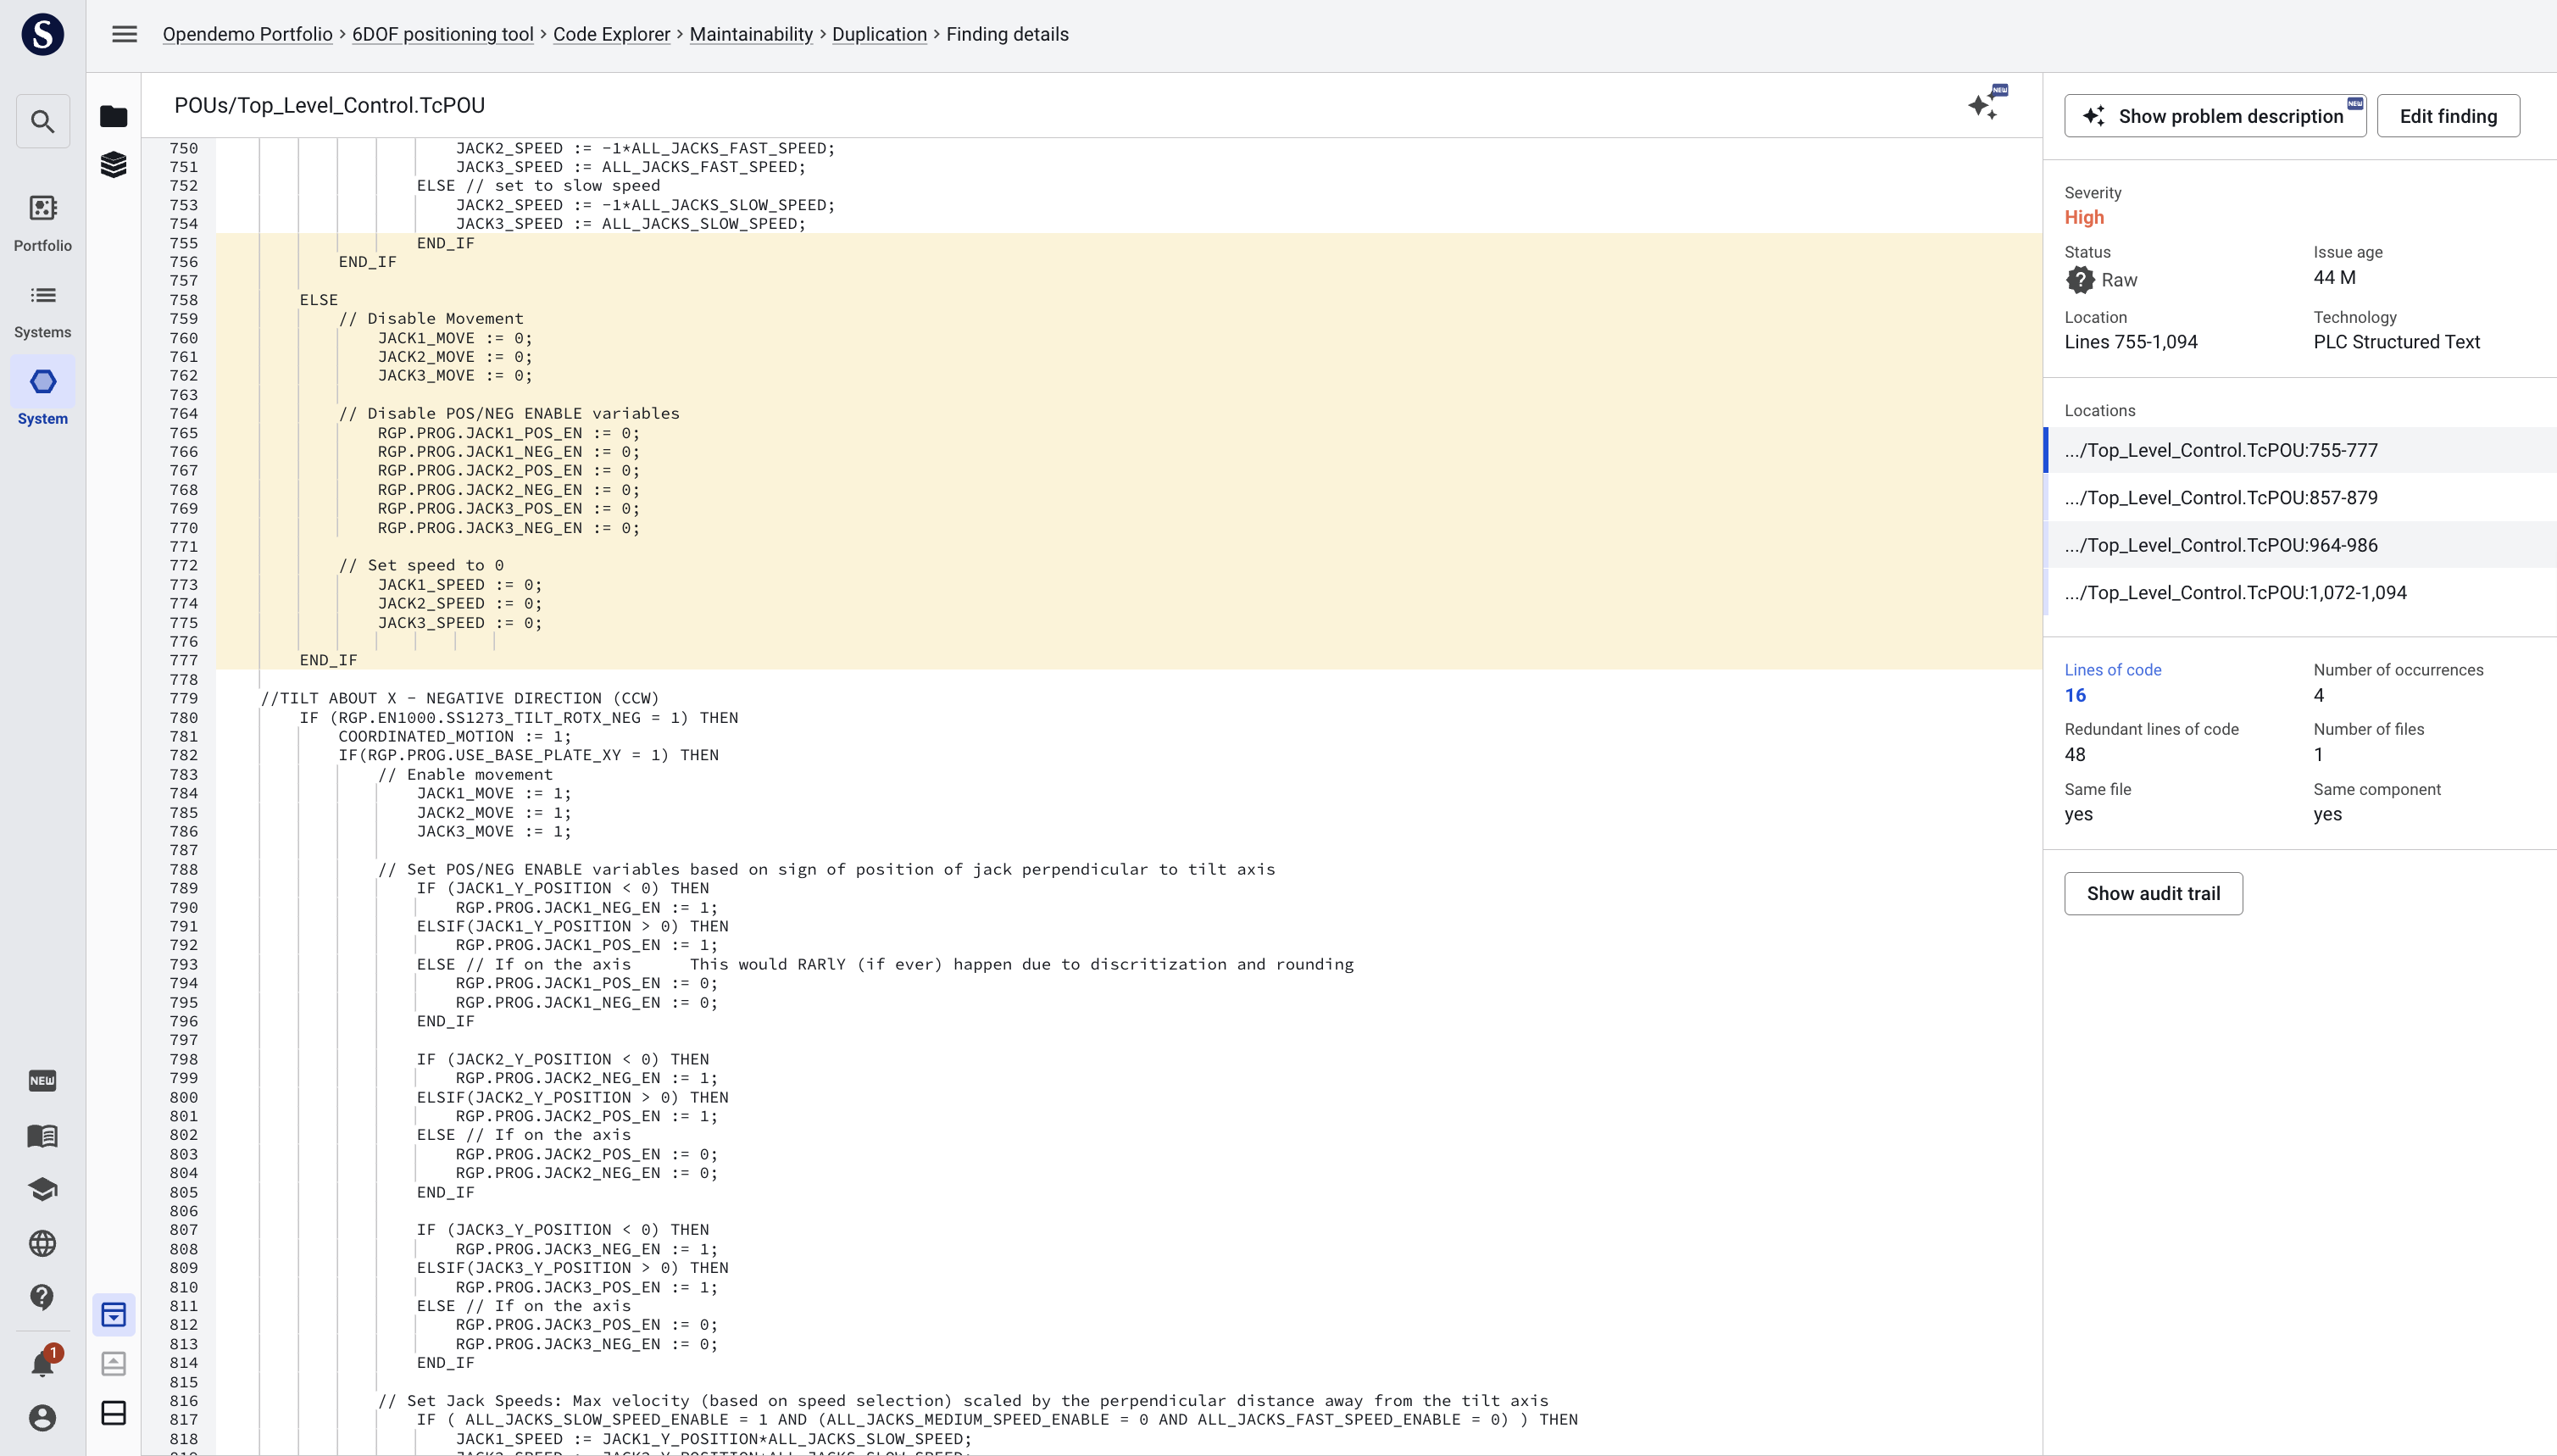
Clicking on a file will show its source in the top panels. By default, focus in the top panel will jump to the first duplication finding. Findings are highlighted on a yellow/orange spectrum. If 2 or more findings overlap, the overlapping space will be accented with a darker shade. By default (when not clicking a specific finding in the bottom panel), a colored slide on the left of the code lines will reflect where findings are present. A mouseover shows the findings.
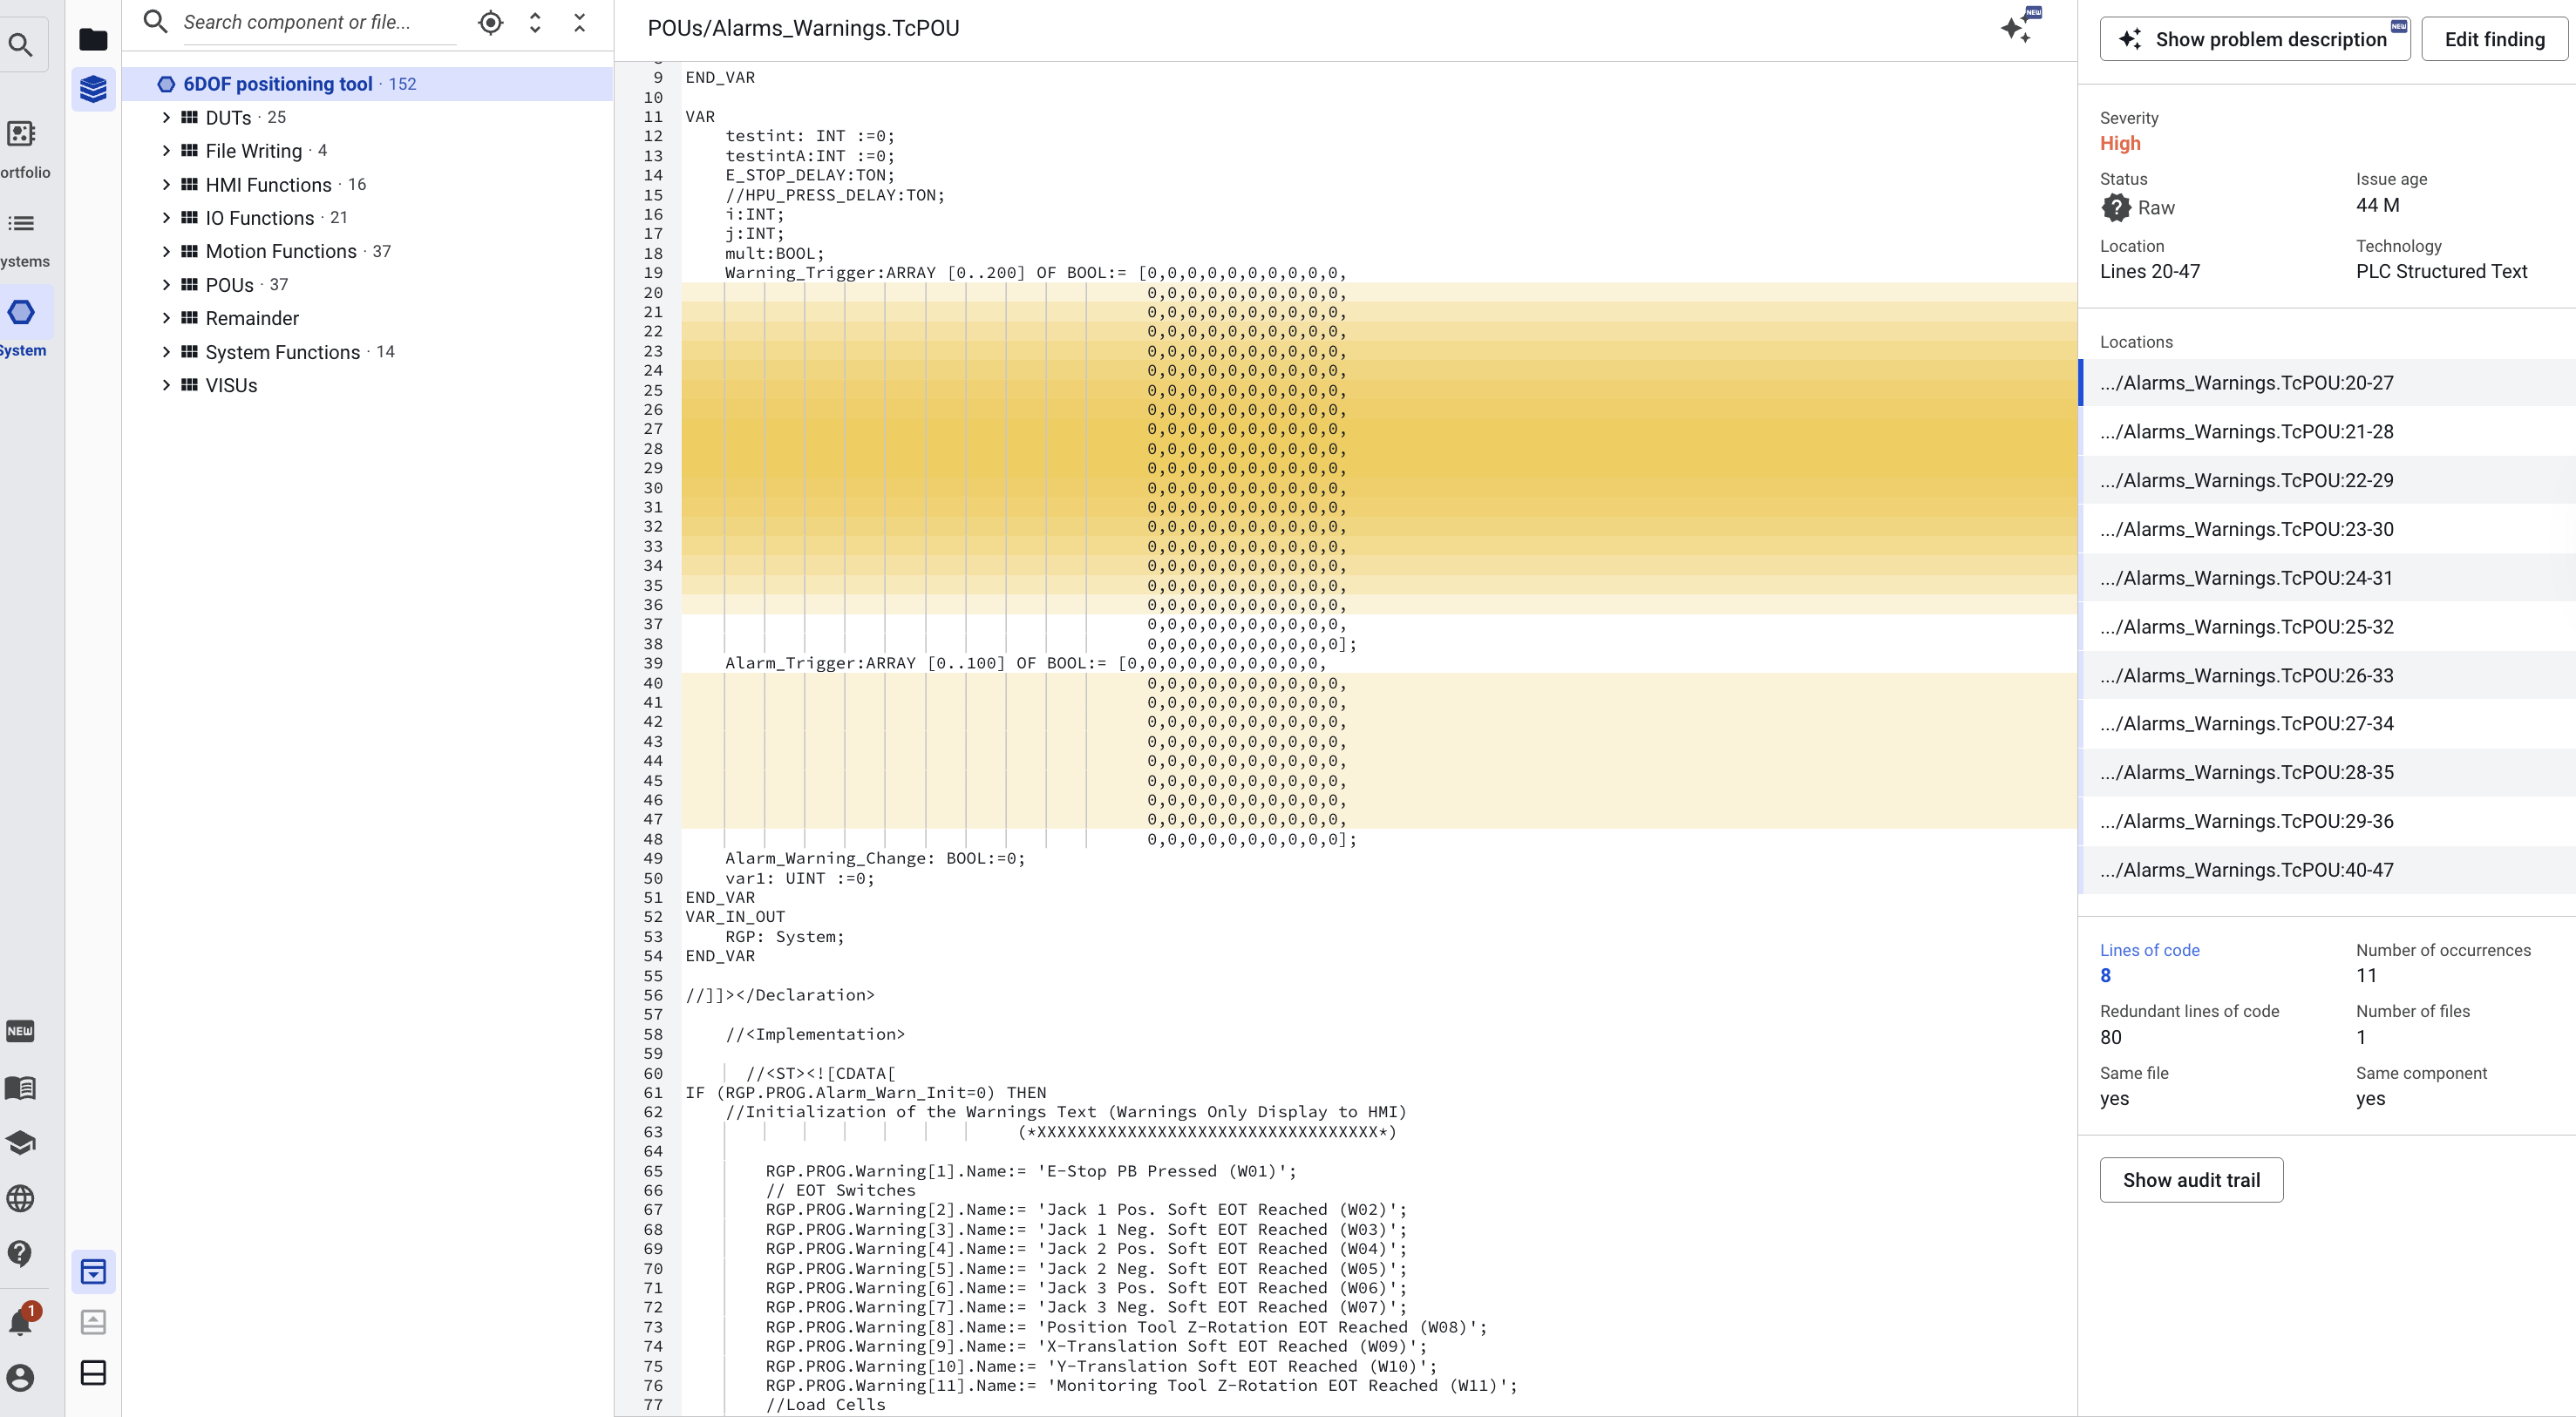
If you click on one specific finding in the bottom panel, only the shade will remain, highlighting that one finding. Sigrid assumes that if you choose a specific finding, you are only interested in that finding at the moment, so it filters the other findings from view.
Clicking on one of the finding characteristics again (e.g. Duplication) will bring back the afore mentioned slide/indication of multiple findings.
If desired, you can fold code blocks - based on curly brackets { and } - by clicking the downwards pointing triangle.
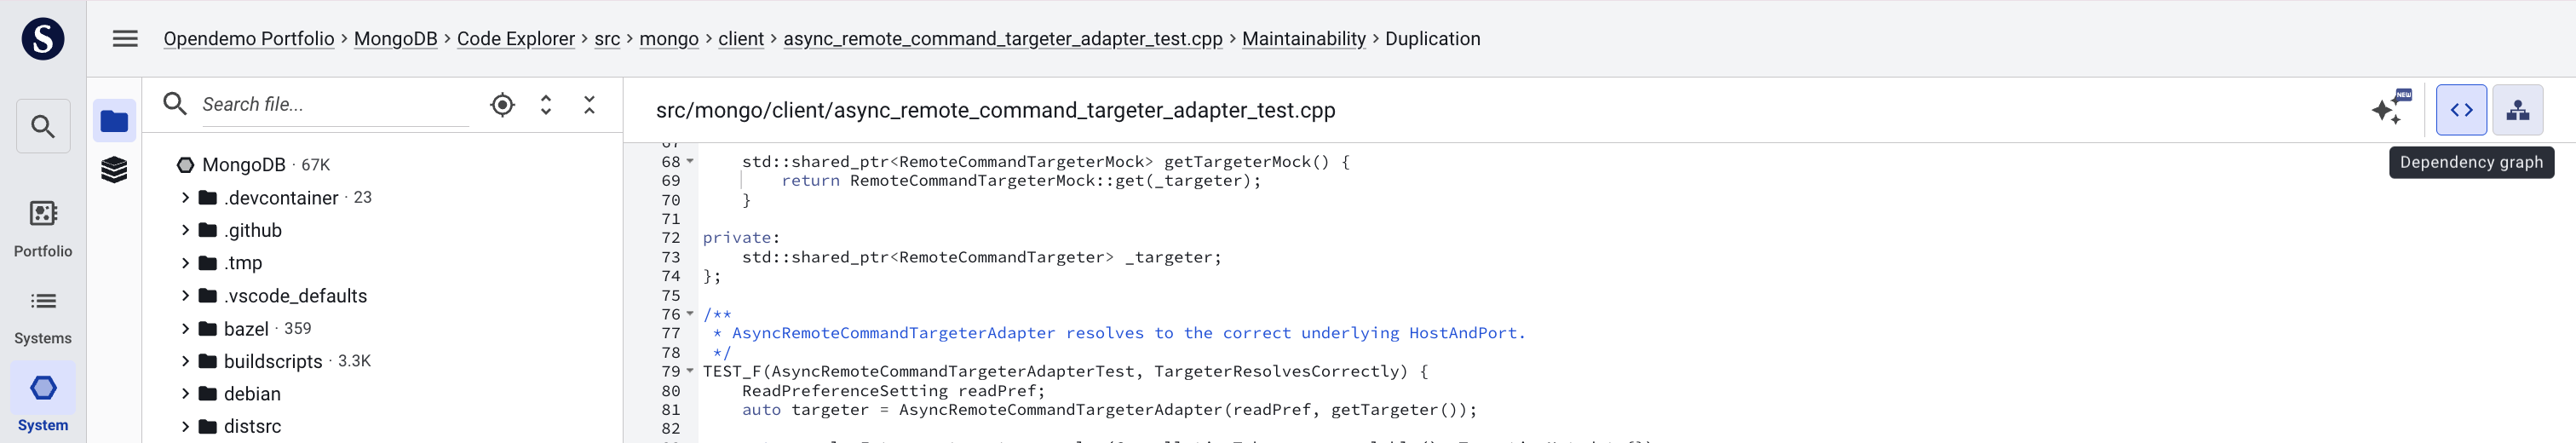
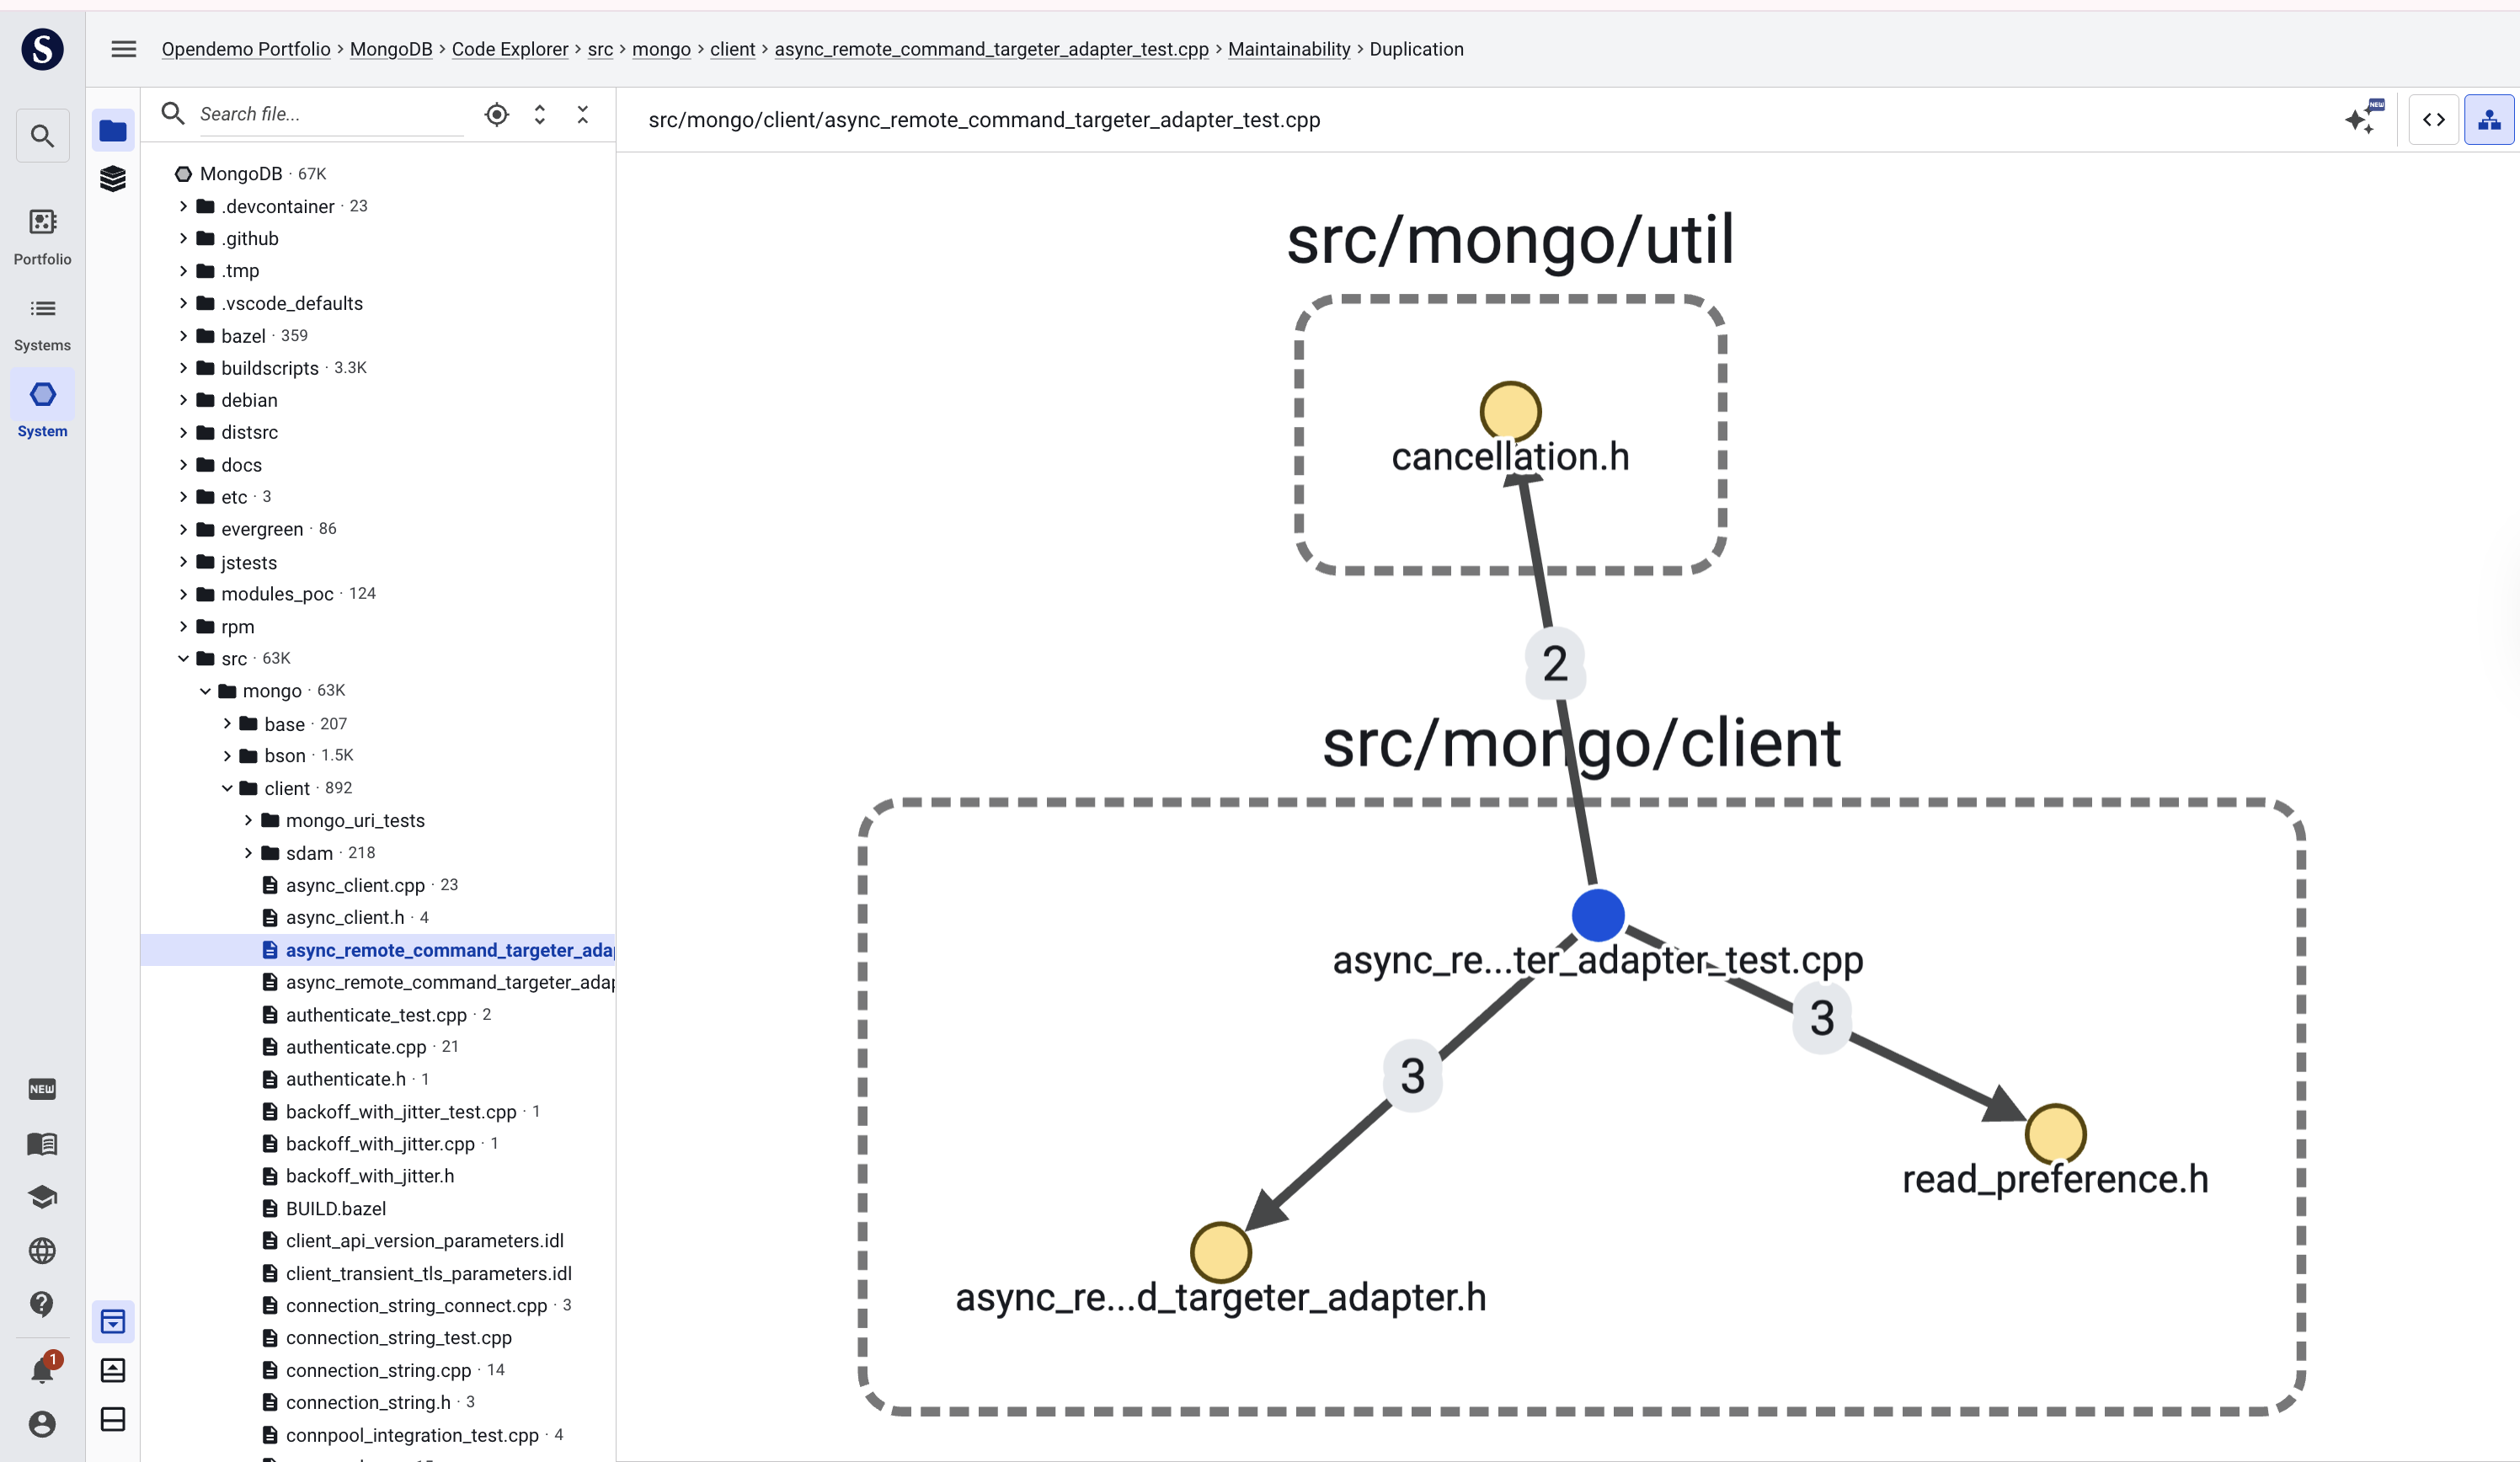
Navigating low-code technologies
When your system is implemented using low-code technologies, the traditional concept of “source code” doesn’t really apply. In those situations, Sigrid will show a process visualization that should look more familiar to developers working on the code. You can use the icons in the top-right to toggle between the visual representation and the text-based representation.
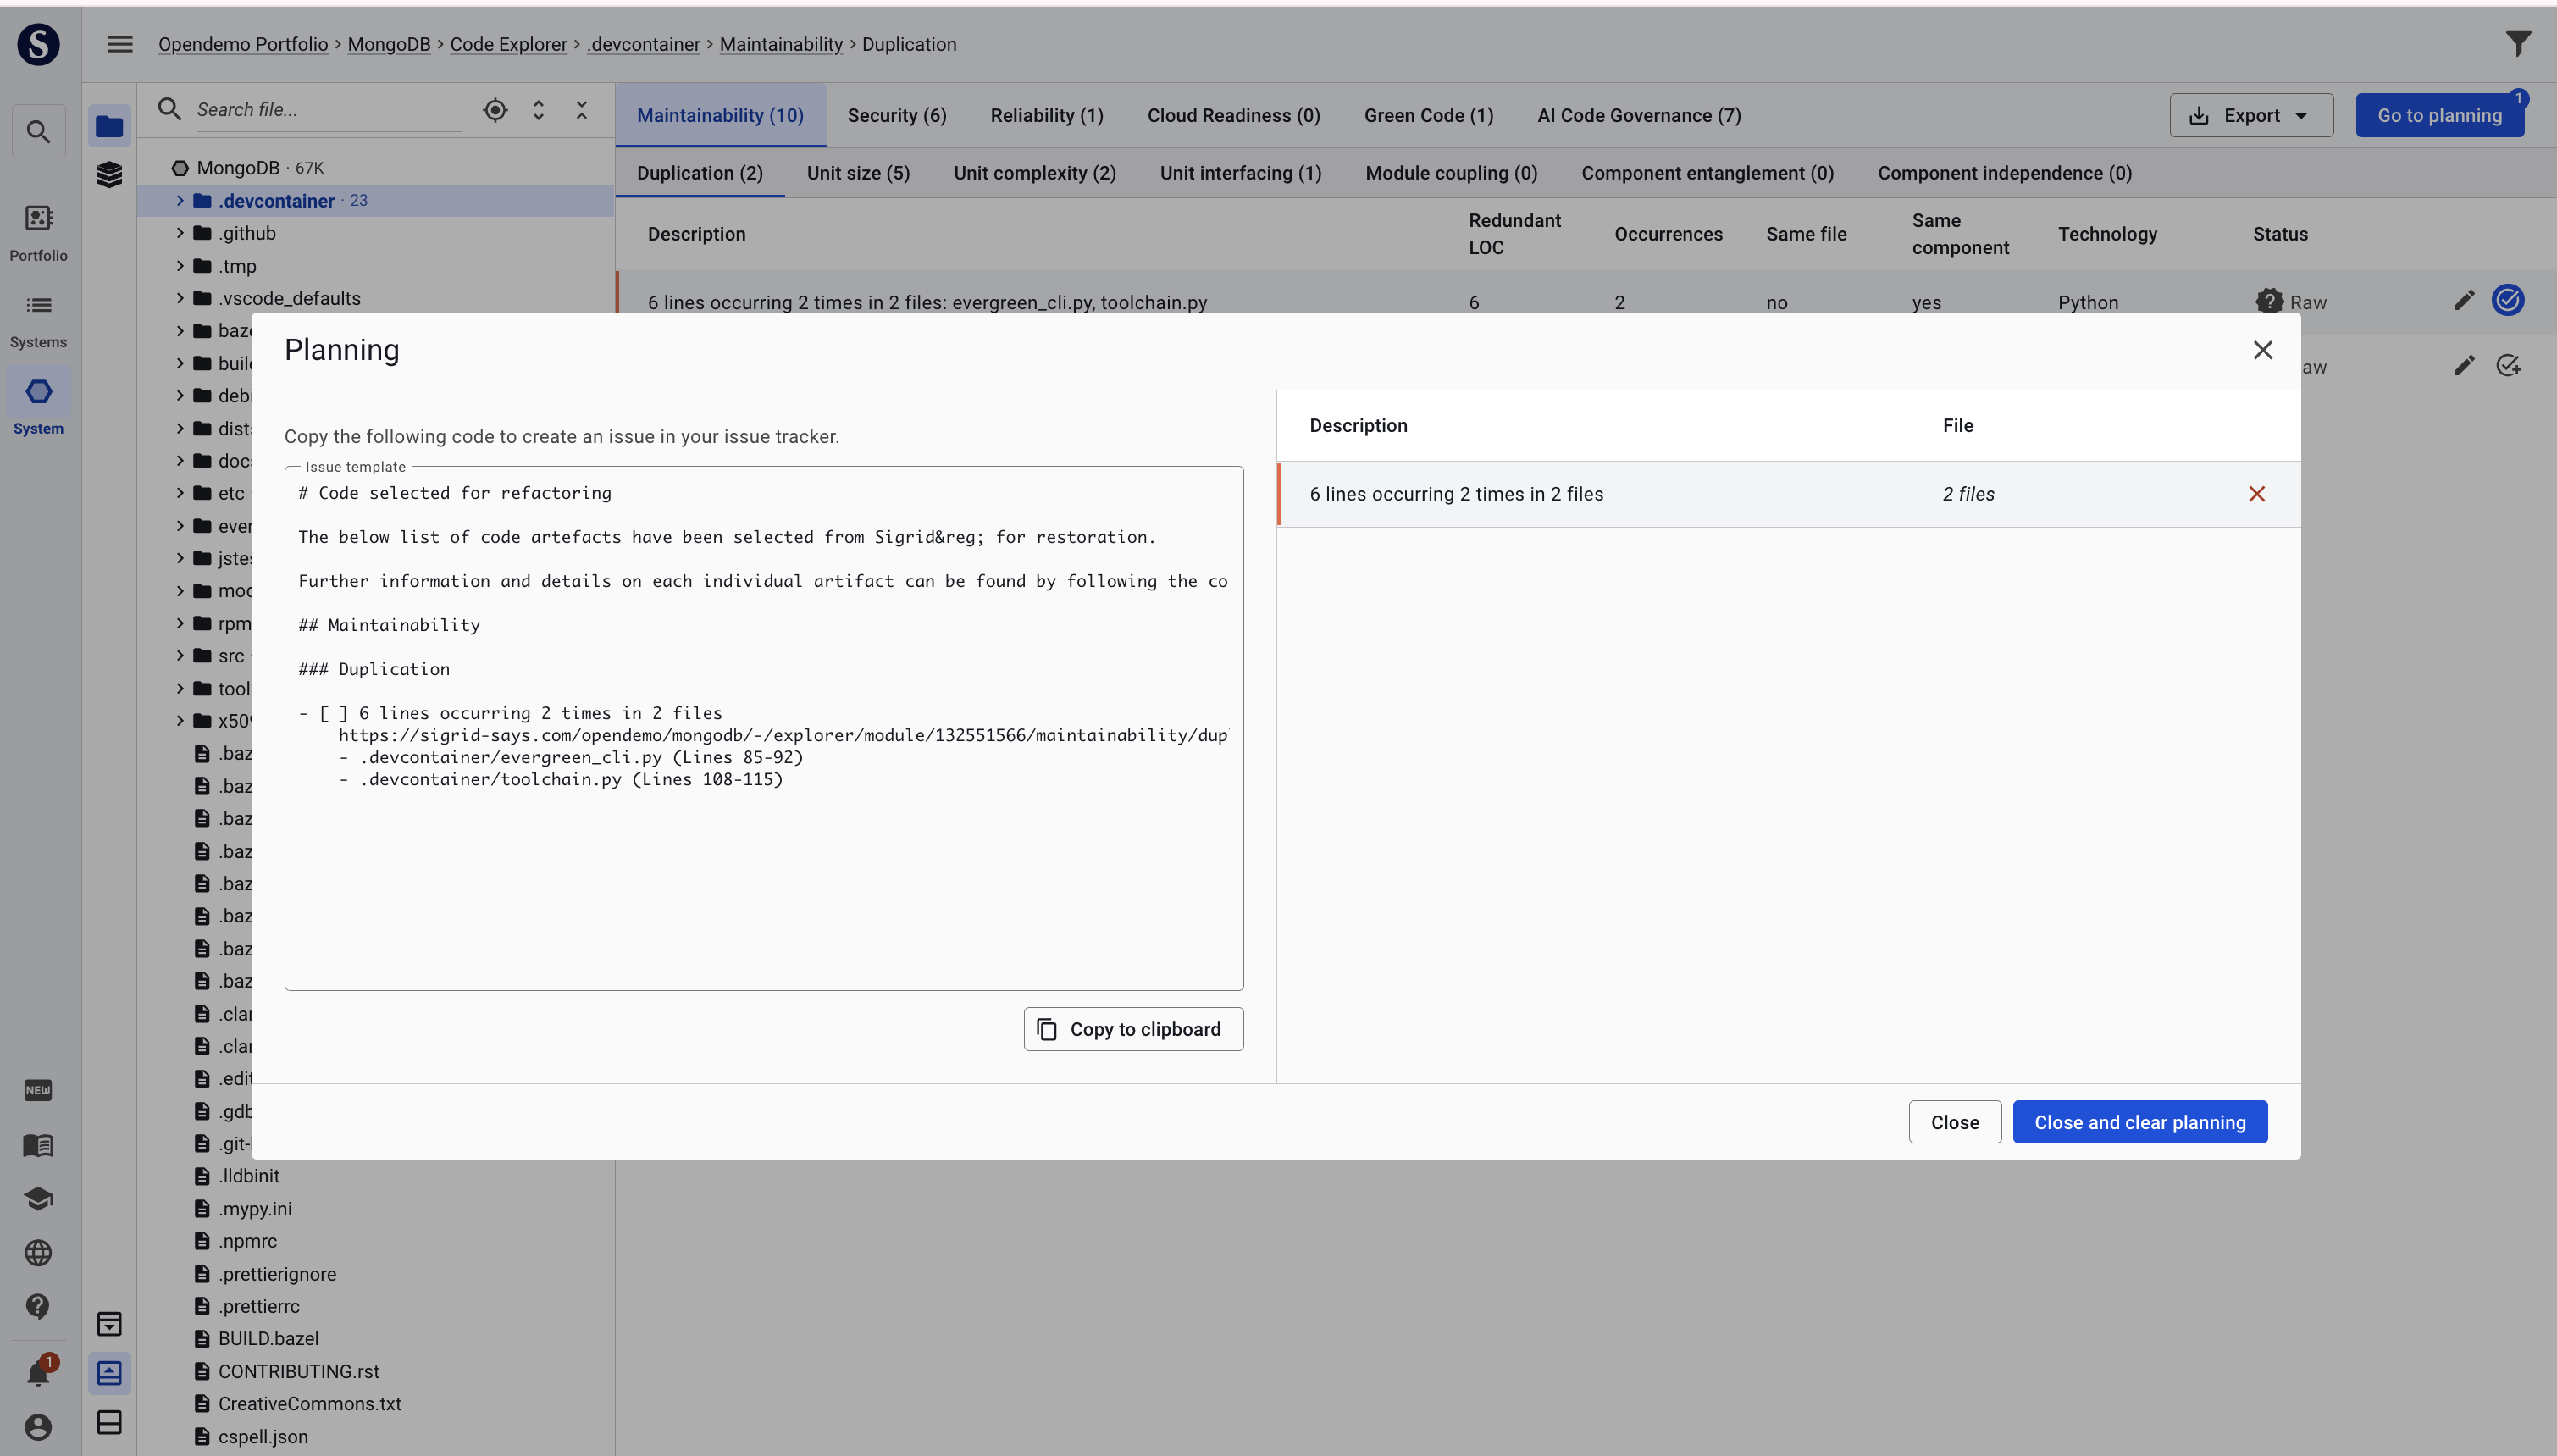
Assisting in planning with issue tracker text
You can choose your finding, hit the “go to planing” button and create an issue that you wish to solve later. It can can be exported as text with static links for your issue tracker.
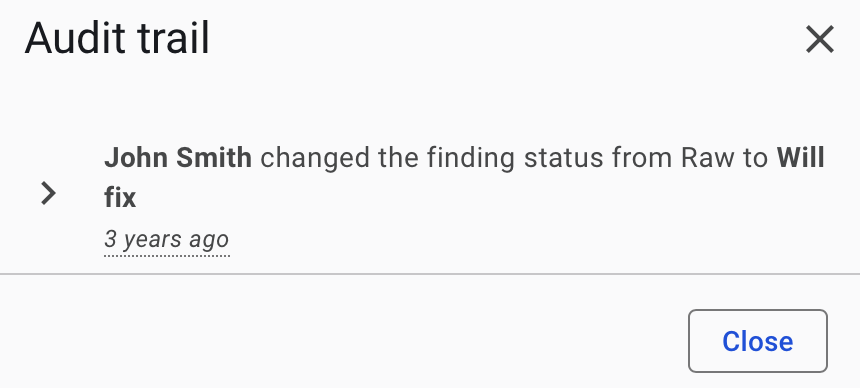
Viewing a finding’s change history and audit trail
In some cases, you may want to track who has made changes to a finding. This can be done by clicking the “show audit trail” button, which will show you an overview of who made changes and when.