

You can use these integrations to check Sigrid findings as you work on your code, triage findings, and export findings to your issue tracker if you're not able to fix them right away.
Have you tried them? We'd love your feedback: Share it in our short survey.
Portfolio-level Open Source Health
The Open Source Health overview page shows a summary of findings and estimated severity.
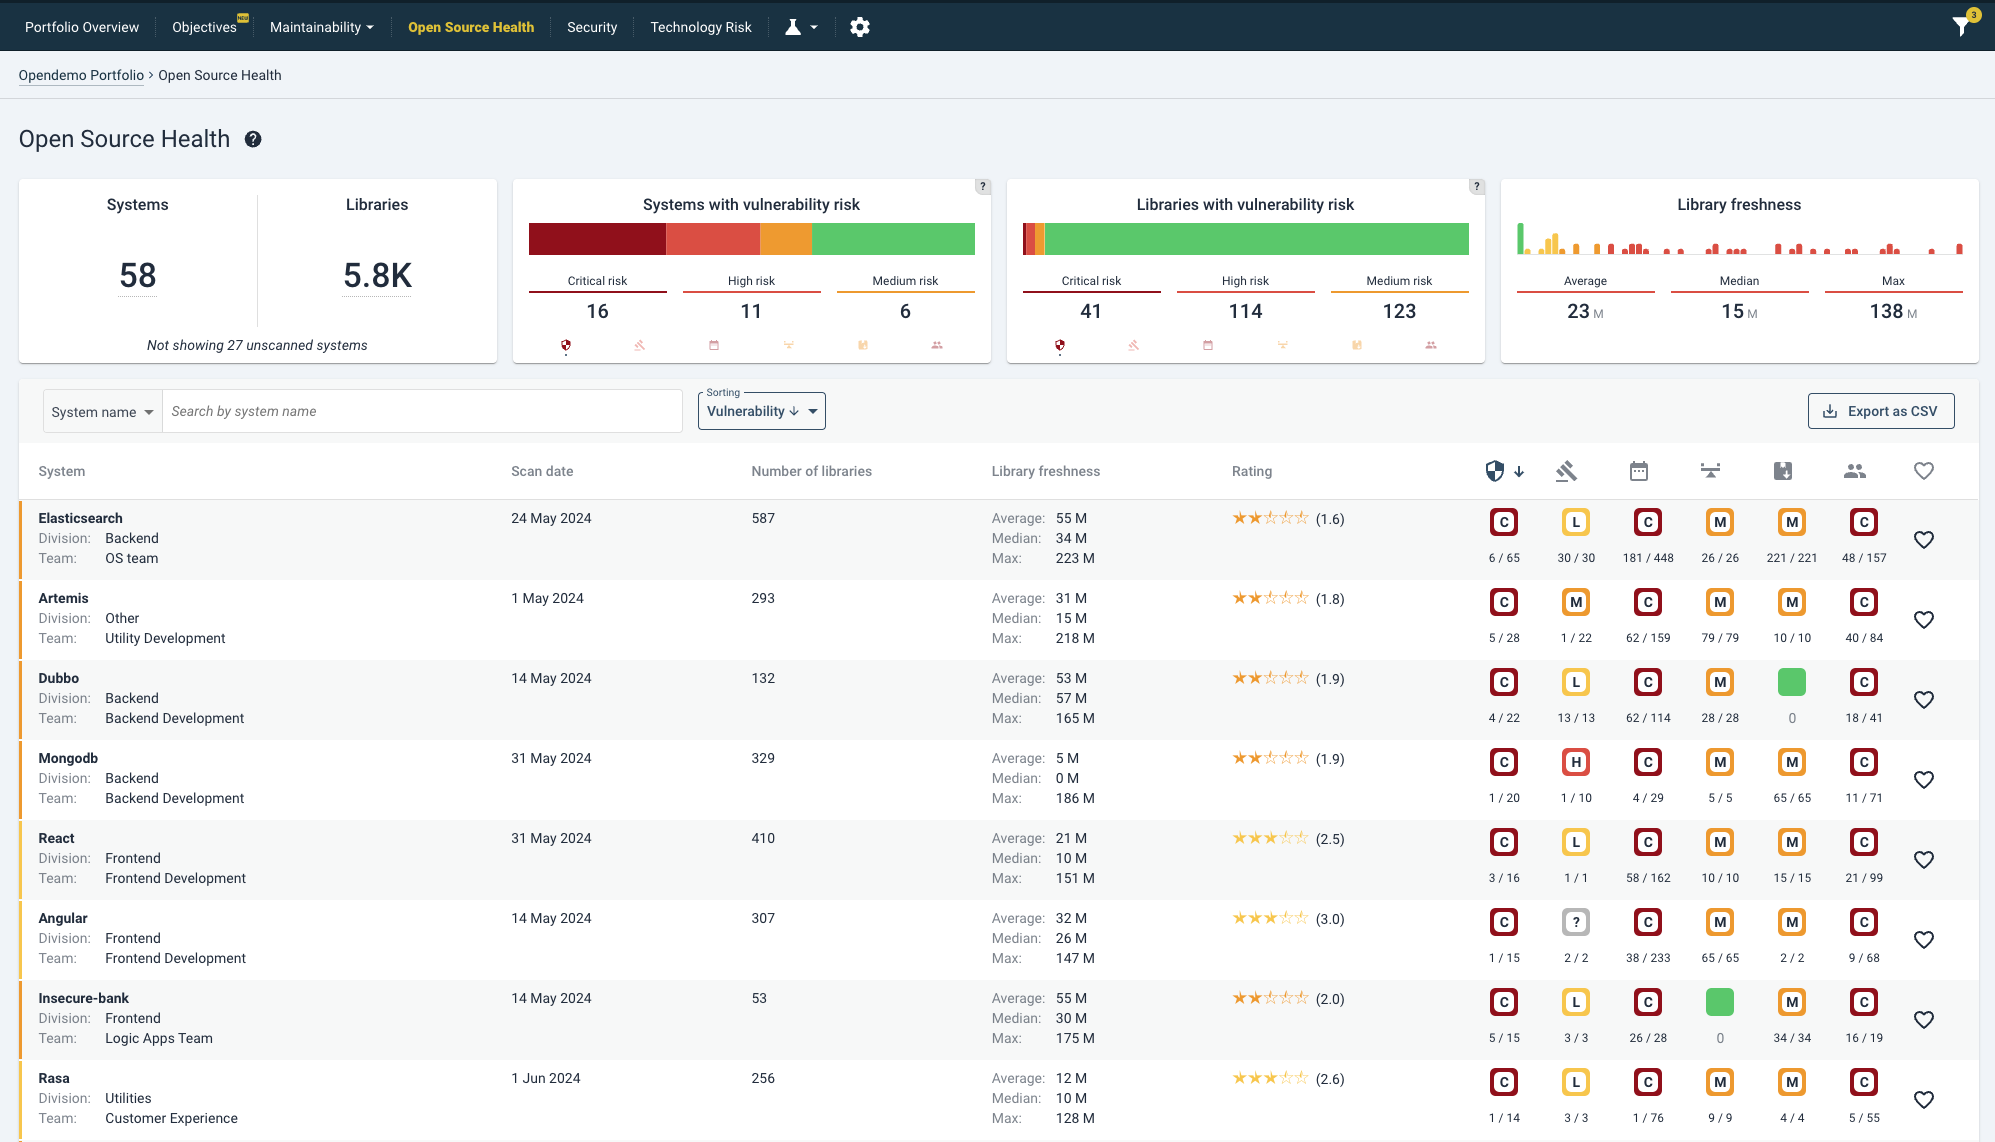
From left to right, the tiles read as follows:
- Systems and libraries: the totals of systems being scanned and the sum of identified (third party) libraries.
- Systems with vulnerability/legal/freshness/.. risk: the count of systems with at least 1 identified risk, ordered by risk category (e.g. low, medium, high or critical).
- Libraries with vulnerability/legal/freshness/..risk: the total count of libraries in each risk category, transcending systems.
Sigrid displays open source vulnerabilities found during the most recent scan. Since new open source vulnerabilities are discovered on a daily basis, it is recommended that you regularly publish your systems to Sigrid, to ensure your Open Source Health dashboard is up-to-date.
6 different risk areas
It is important to know how Open Source Health groups its findings. Open Source Health scans for 6 different risk areas. For an elaboration, please see the relevant paragraph in the page describing system-level view of Open Source Health. Risks are then classified and colored as  low,
low,  medium,
  high, or
  critical based on their CVSS score. See also our elaboration on how CVSS works and on how risks are visualized in Sigrid.
The 6 categories are present on the bottom of the tiles that show the sum of number of risks.
critical based on their CVSS score. See also our elaboration on how CVSS works and on how risks are visualized in Sigrid.
The 6 categories are present on the bottom of the tiles that show the sum of number of risks.

 The help button in the tile’s upper right corner shows mouseovers for each category that you select.
In the bottom part of the screen, each system is shown with a summary of its counts: number of libraries and findings per category. For larger portfolios it may be useful to sort these on different characteristics.
Sorting can be done per columns (here, “Vulnerability” as an example). The top right bottom for exporting the data as a spreadsheet may be useful for further analysis.

Filtering internal dependencies
Internal dependencies can be filtered manually, such that they will not be resolved with the Open Source Health APIs that Sigrid uses. Please see the Open Source Health paragraph in our scope configuration document or this related question in the FAQ.