Portfolio-level security
If you have a portfolio of systems in Sigrid and licenses enabled for Security, Security will be visible in the top bar.

Your URL will be of the convention https://sigrid-says.com/[clientname]/-/open-source-health, whereas system details will follow https://sigrid-says.com/[clientname]/systemname/-/open-source-health.
Another way to arrive here is clicking on the top capability tiles on the Portfolio overview page. See the portfolio overview page.
Moving from portfolio level to system level
Since the portfolio view is a summary of system level findings, please refer to the system-level view of Open Source Health. For example, clicking on a system name in the portfolio overview will bring you to the system’s details.
Portfolio-level Security overview
The security overview page shows a summary of findings and estimated severity. From left to right, the tiles read as follows:
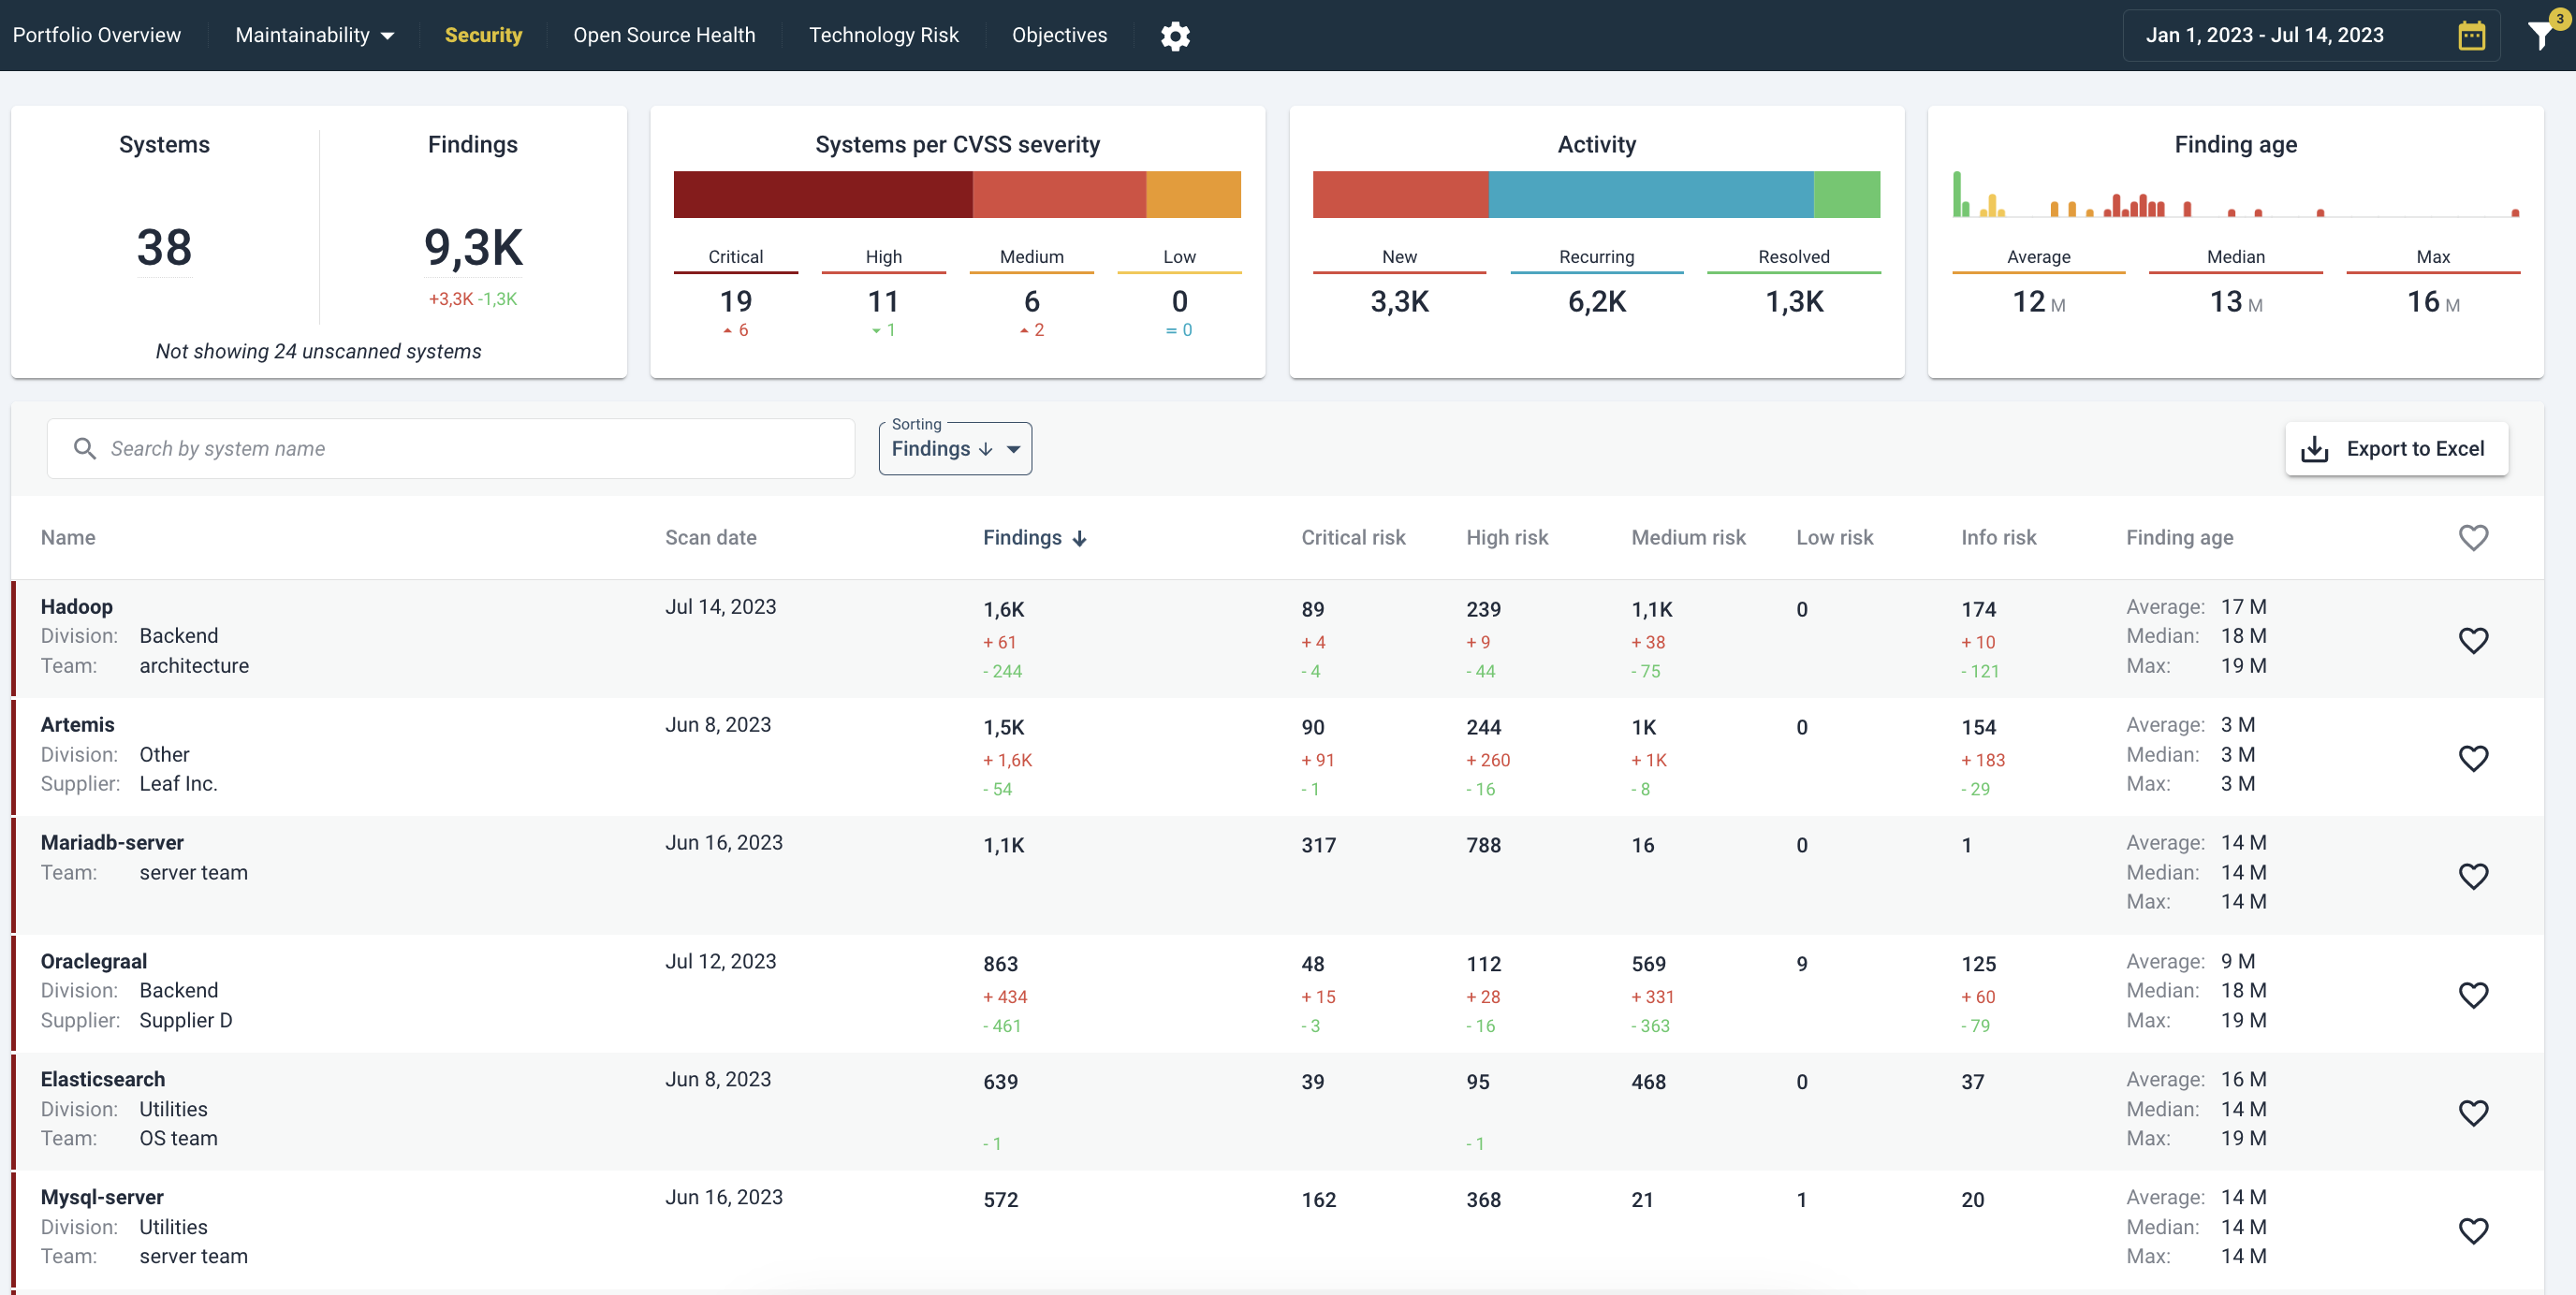
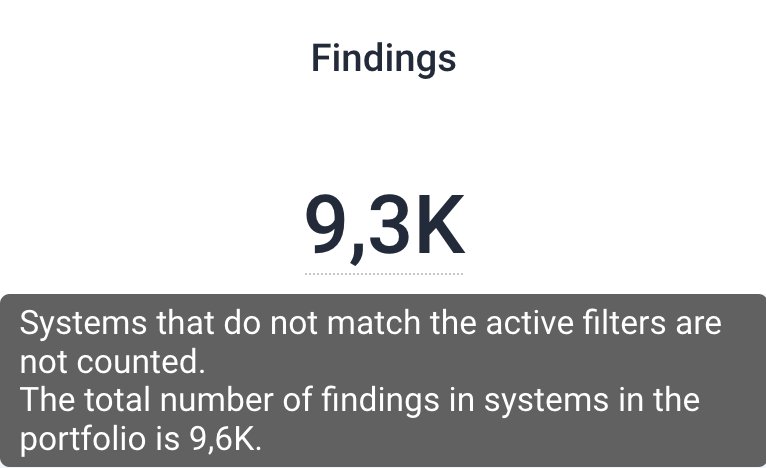
- Systems and Findings: the totals of systems being scanned and the sum of identified Findings. Below those counts, it shows the total changes over the selected time period. A mouseover shows an elaboration:
- Systems per CVSS severity: the count of systems where their highest-risk finding is in these risk categories, i.e.
 Low,
Low,  Medium,
  High, or
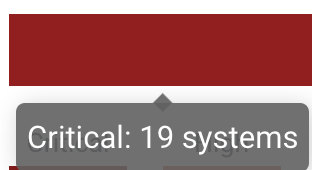
  Critical. A mouseover on the colored bar shows the exact count:
- Activity: the count of New, Recurring and Resolved findings over the selected time period in the top right corner data selector. Note that the sums for New and Resolved are the same totals as shown in the Findings tile on the left. A mouseover on the colored bar shows the exact count:
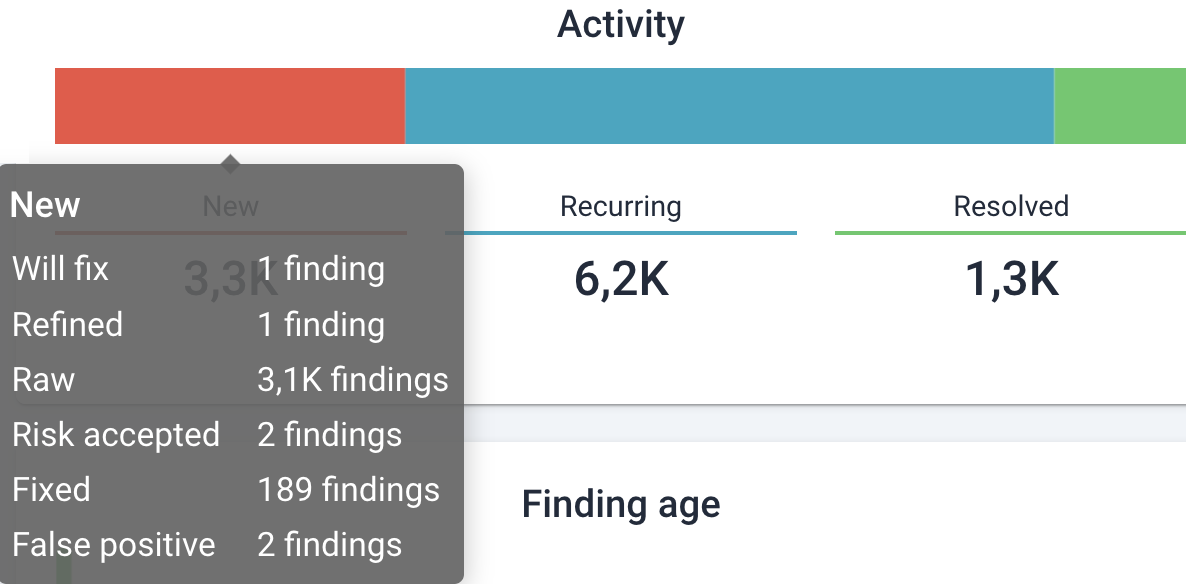
- Finding age: the distribution (Average, Medium, or Max) of how old unresolved findings are, as number of systems. The mouseover shows the exact counts, as below.
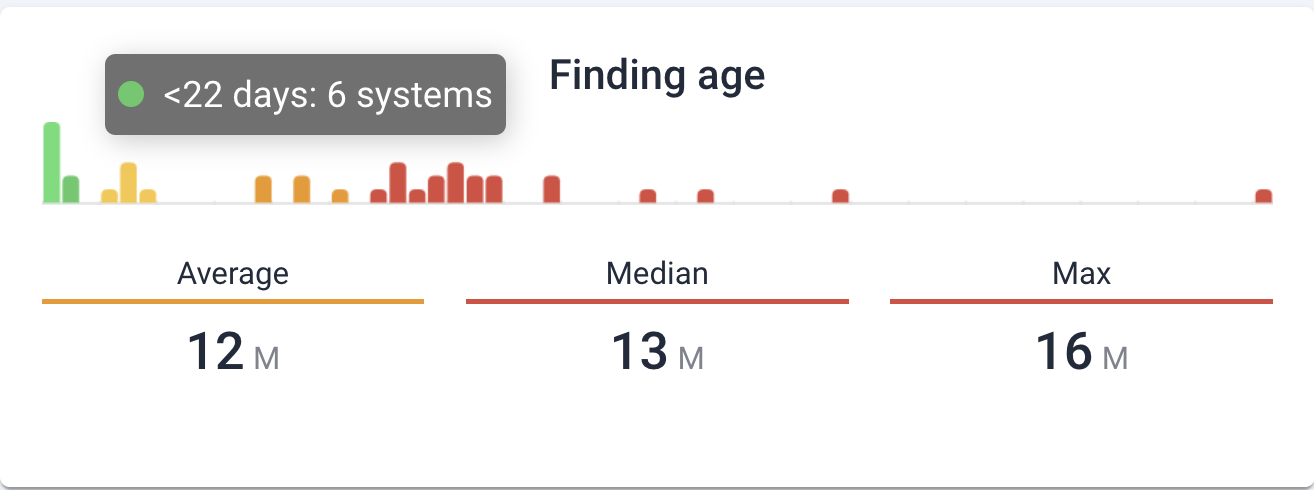
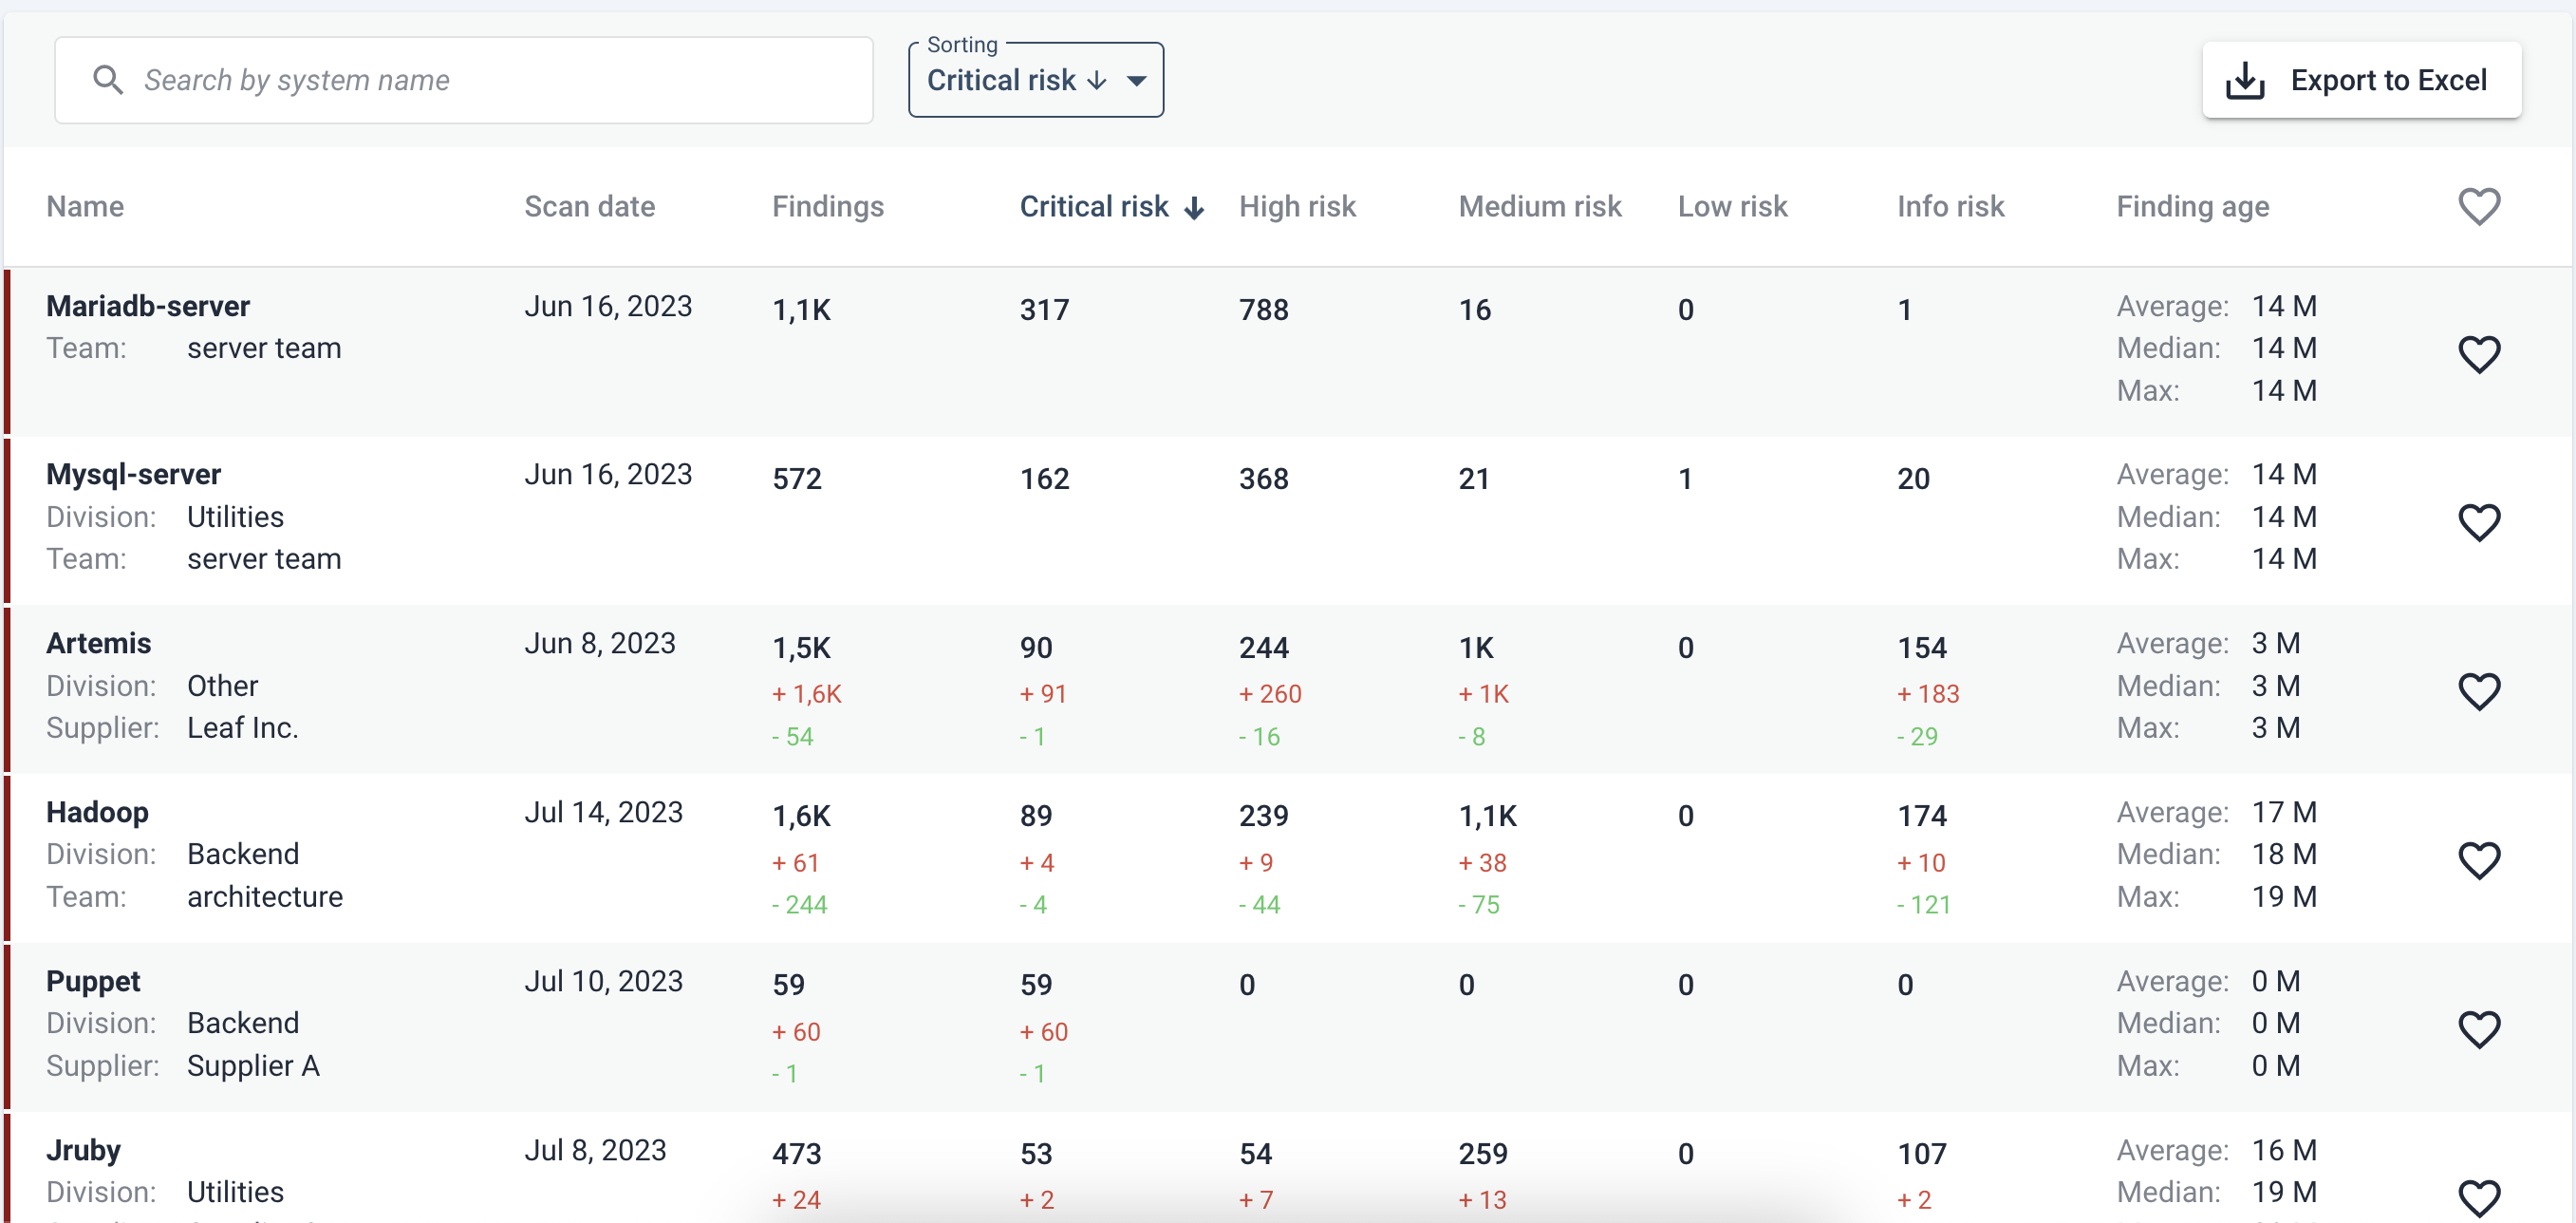
In the bottom part of the screen, each system is shown with a summary of its counts: number of findings per CVSS risk category and Finding age counts. For larger portfolios it may be useful to sort these on different characteristics. Its menu, by default set on sorting order by total number of “Finding”, is as follows:

Sorting can also be done per columns (here, the total number of “Critical risk” findings as an example). The top right bottom for exporting the data as a spreadsheet may be useful for further analysis.
