
You can use these integrations to check Sigrid findings as you work on your code, triage findings, and export findings to your issue tracker if you're not able to fix them right away.
Have you tried them? We'd love your feedback: share it in our short survey.
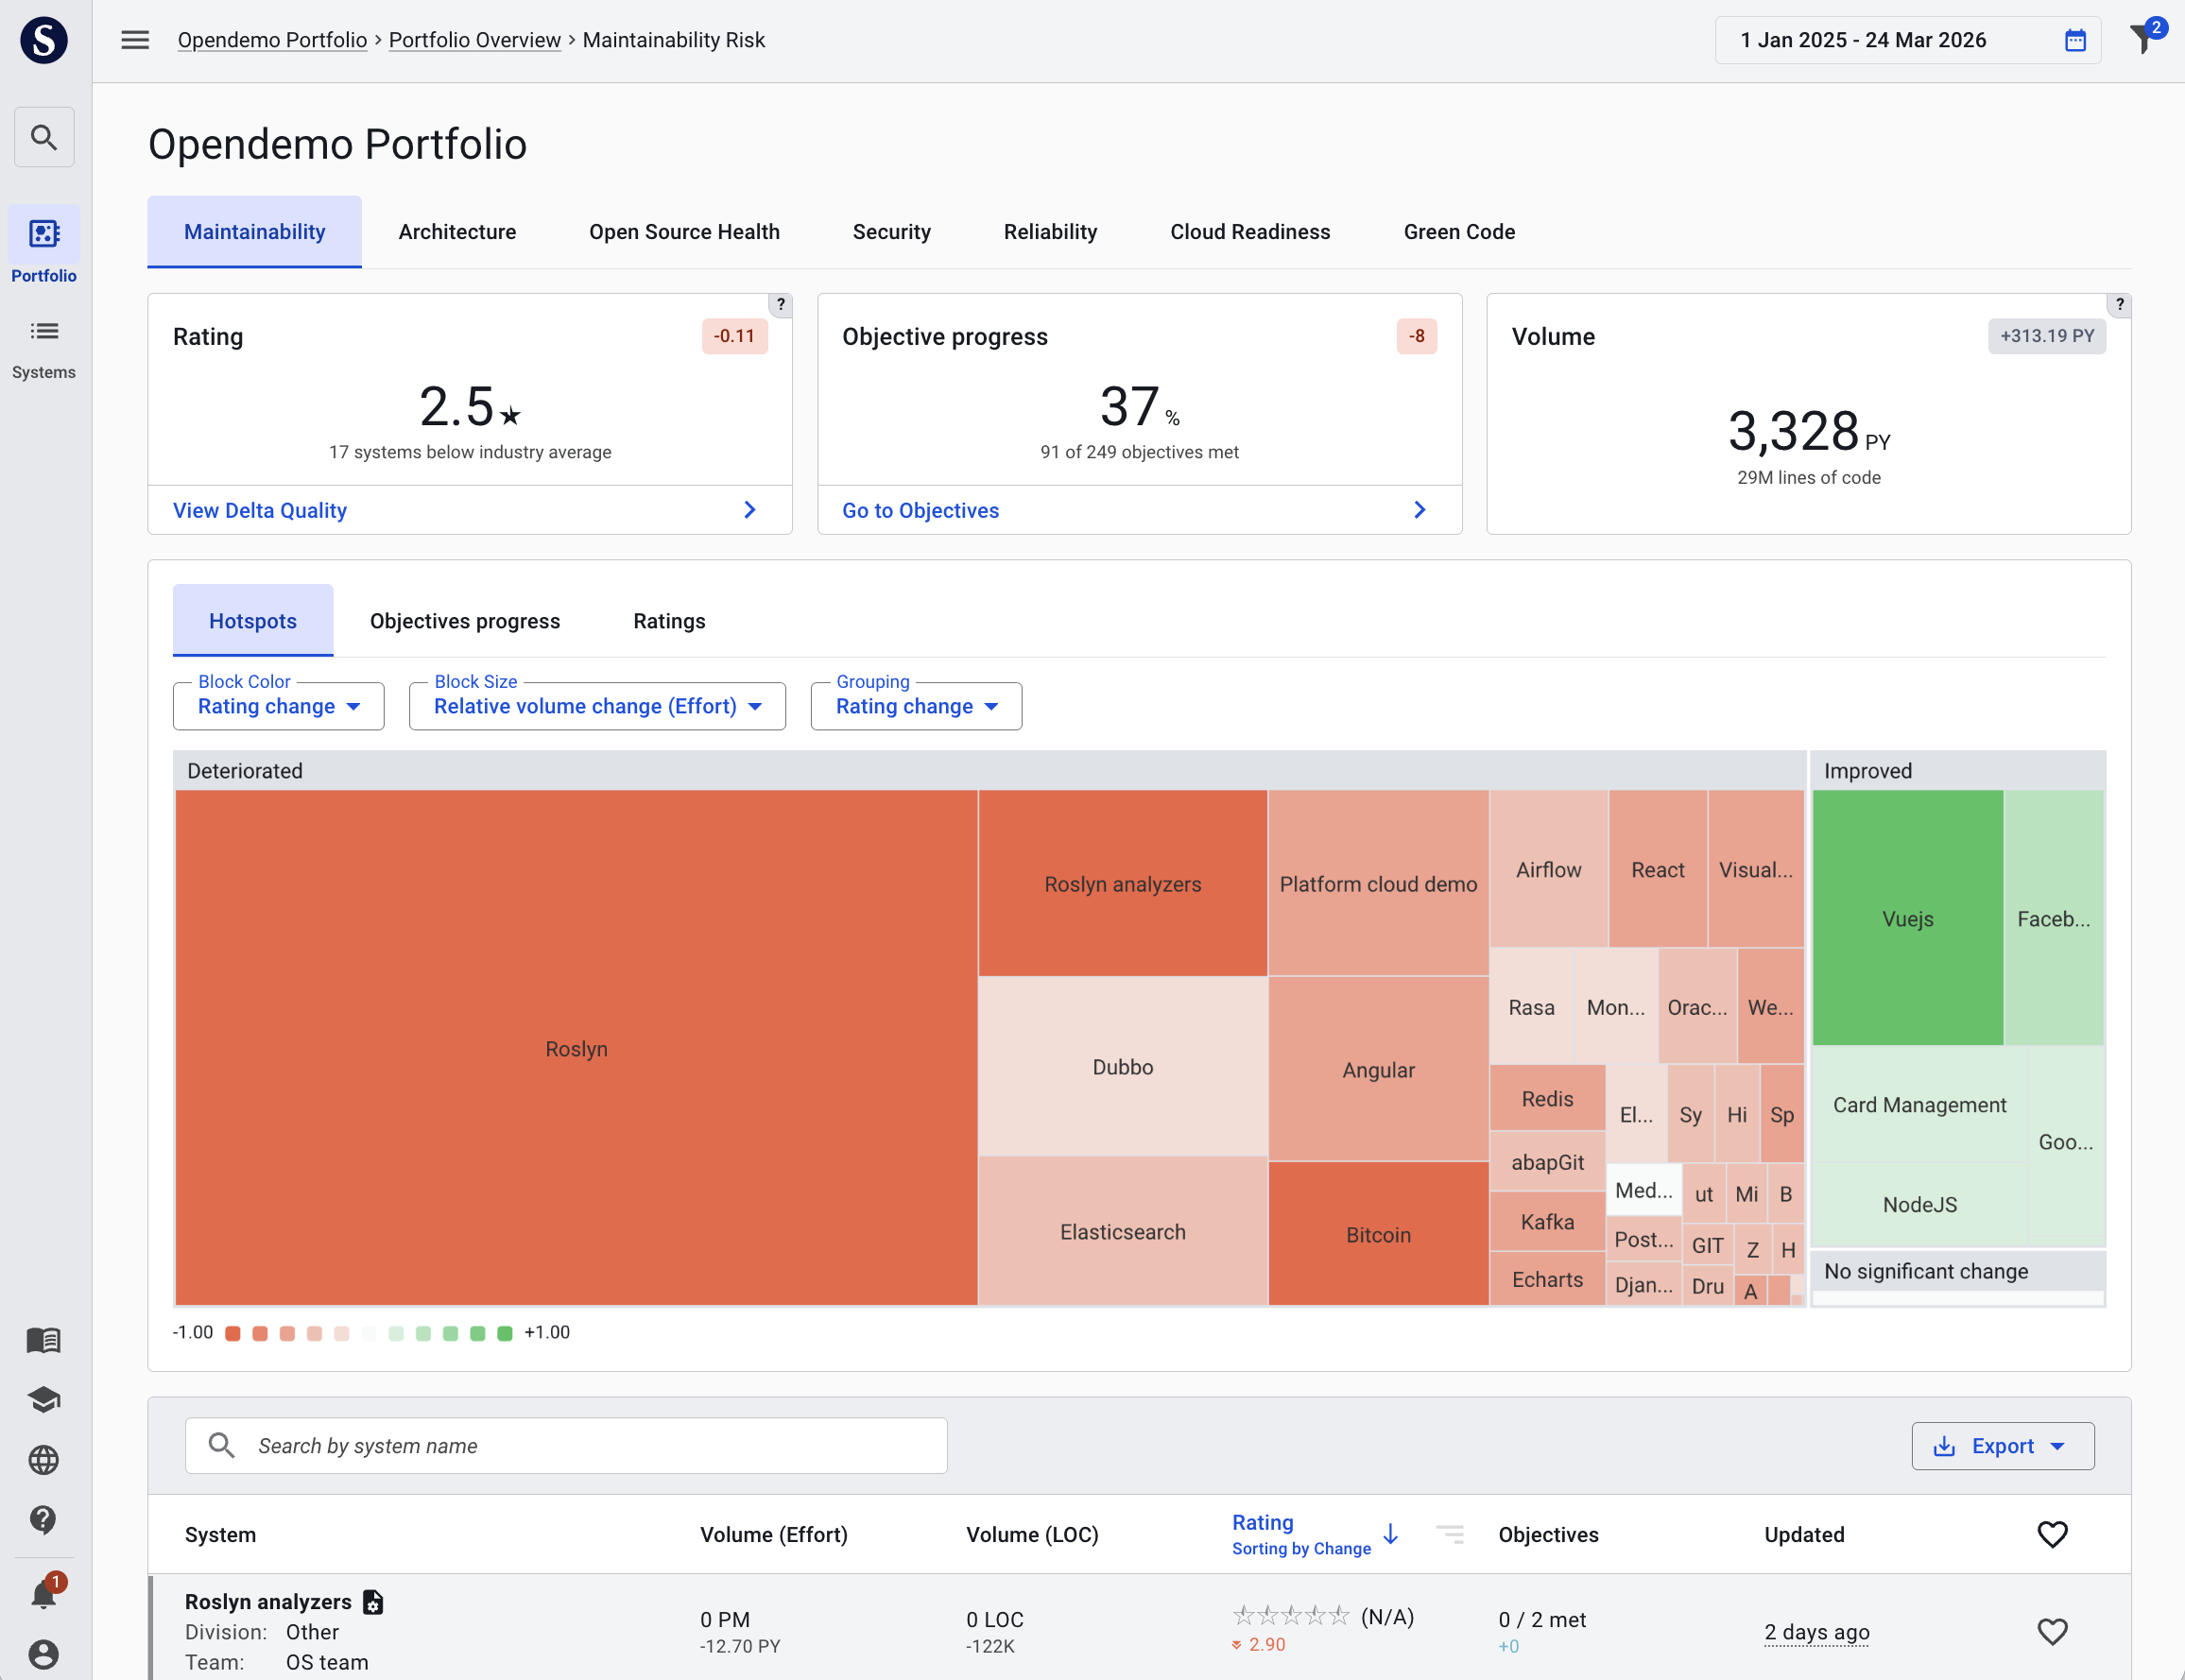
The Portfolio Overview
This portfolio overview focuses on overall quality performance trend, acute risks, and progress toward objectives across systems. These insights help users prioritize which systems need to be improved. In short, the portfolio overview answers the following questions:
- Where should we give attention and investigate further?
- Where should we prioritize our next actions?
- Are we progressing toward our targets?
The following sections elaborate on how to use and interpret the different elements of the portfolio overview.
1. Capability tabs
At the top of the portfolio, individual tabs for each capability enable you to view your portfolio insights for a selected capability. Selecting a specific capability affects all the insights displayed below it, on the rest of the page.
2. KPI cards
The key performance indicator cards summarize essential progress information for the selected capability. These cards can differ slightly per capability, as different capabilities have different key insights. For the maintainability page the KPI cards look as follows:
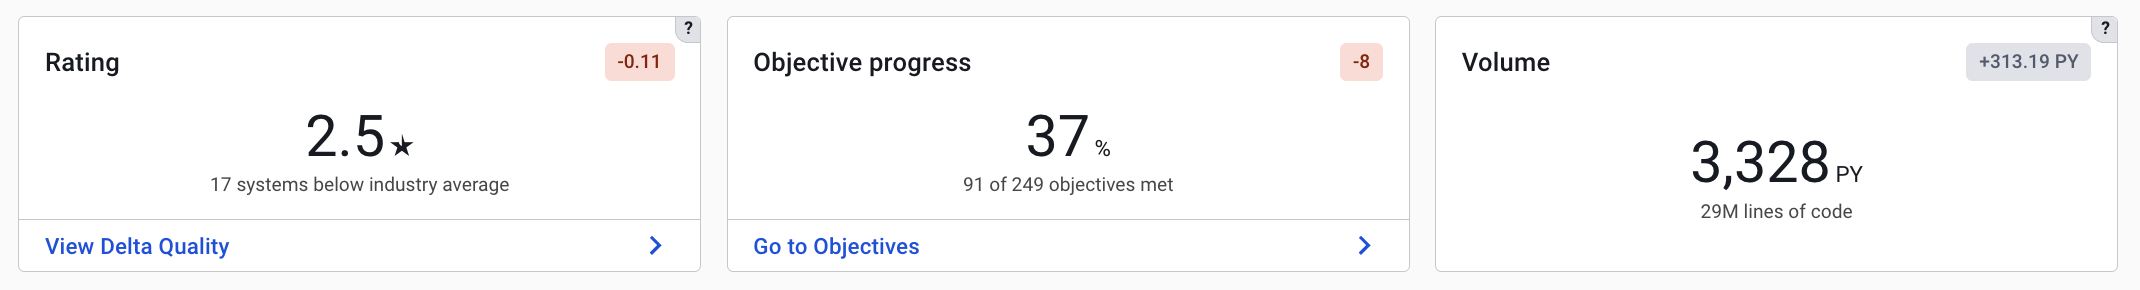
Typical cards across the different capabilties (e.g. Maintainability, Architecture, Security, AI) are:
- Quality Rating shows the overall maintainability score and its recent change;
- Acute Risk highlights how many systems with open acute (critical and high) risk your portfolio has, if there are more systems with acute risk;
- Improving/Declining Systems highlights how many systems are getting better, compared to the number of systems that is declining;
- Objectives Completion indicates progress towards defined objectives across the portfolio;
- Volume shows the change of code volume (and therefore development activity) across portfolio.
3. Treemap tabs
The treemap (the large graphic with the colored blocks) gives different views into your portfolio. Those different views can be reached via the tabs directly above the treemap, and each highlight important insights about your portfolio, helping you to quickly drill down towards the parts of your portfolio that need attention. For each different tab, the meaning of the Area, Color, and Grouping are displayed. This configuration differs for each tab, and can be manually adjusted to receive custom insights.
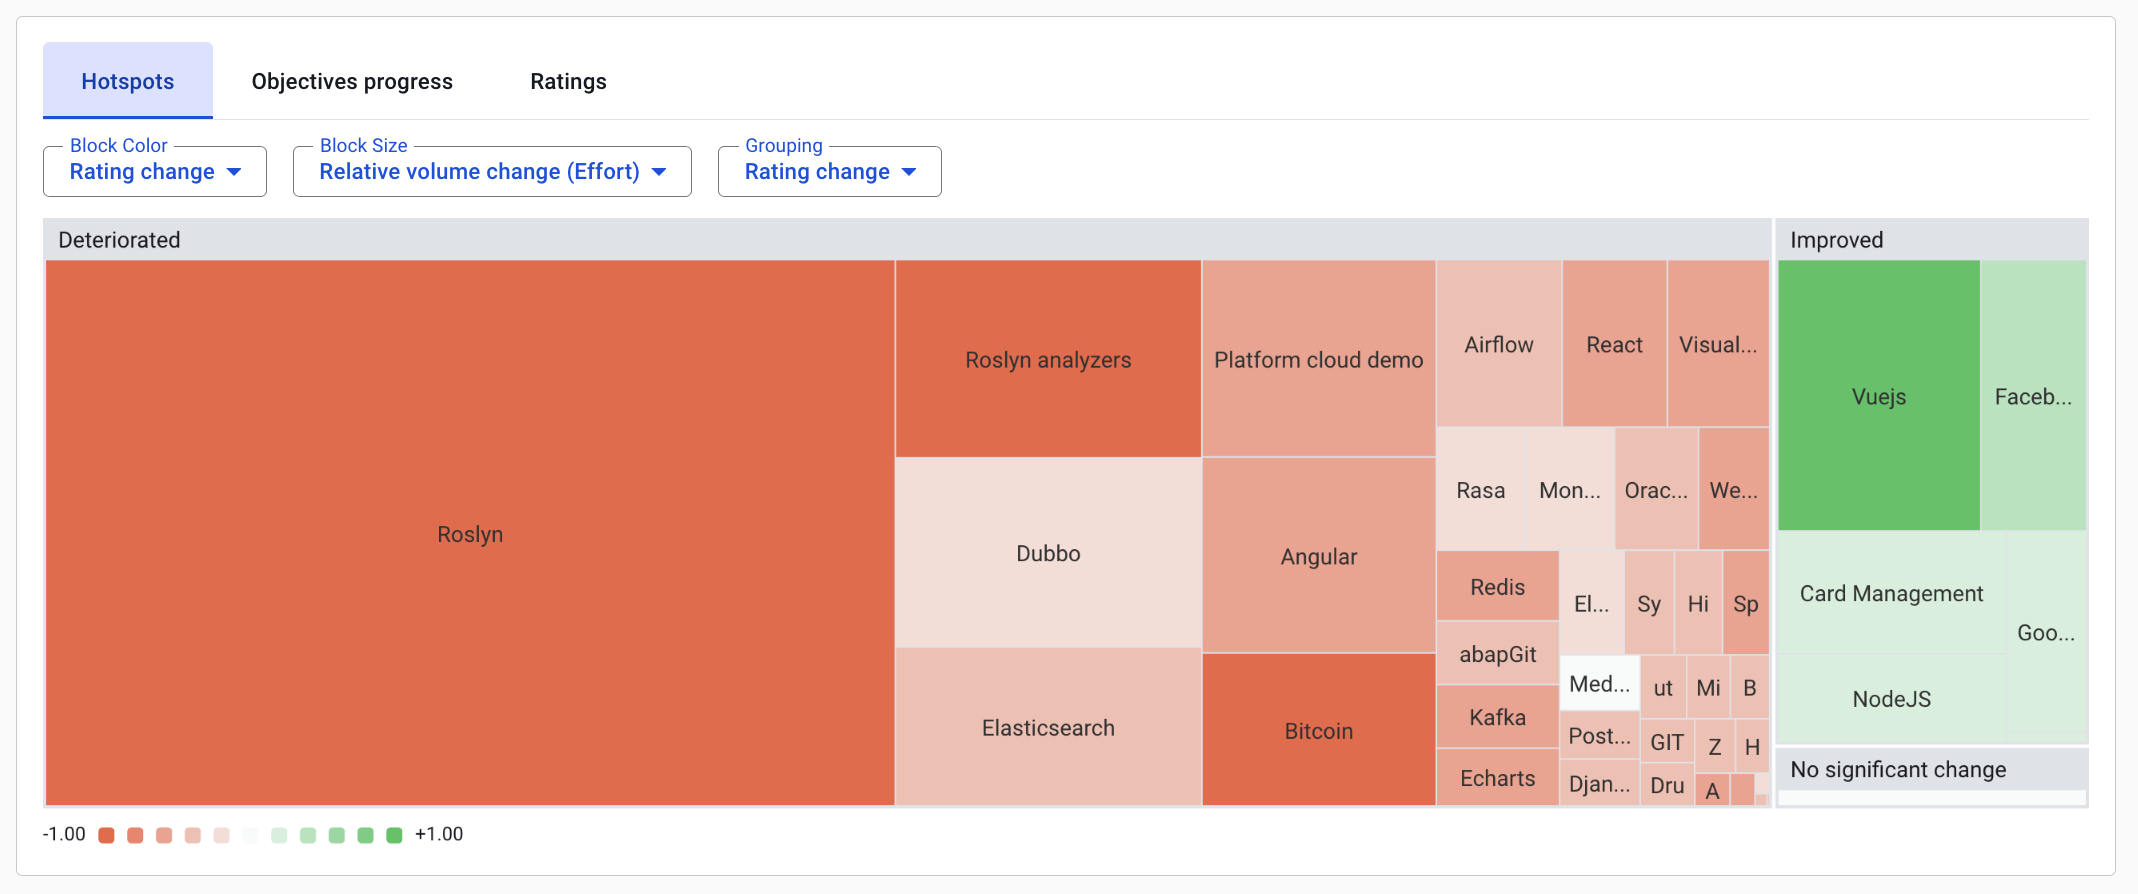
Hotspots
A Hotspot is a system which has seen high development activity during the selected period. Hotspots represent areas of attention, since code changes are where deterioration or improvement of code quality happen. Being on top of these hotspots is essential for being in control of quality and risk trends over time. For the Hotspots tab, the default treemap configuration is as follows:
- Block color: the color of the blocks represents the quality delta of the system as a whole (as a result of the code changes), comparing the current system rating against the previous quality rating of the system at the start of the selected period. The colour intensity scale is dynamic, and is based on the largest deterioration/improvement in the selected period.
- Block size: each block accounts for a system, and the size of the block represents the amount of change in development effort (e.g., code changes/Person Years) the system has received in the selected period. Systems that have not received any changes in the selected period are excluded from the overview.
- Grouping: the systems are grouped together based either deterioration or improvement of the code quality.
Use the hotspots to find out:
Which areas in my portfolio require attention to prevent quality decay?
Objective Progress:
The Objective Progress view shifts the focus from general risk discovery (Hotspots) to governance and policy tracking (Objective Progress). In this tab, the treemap presents an easy and visual overview of how the objectives in your portfolio are progressing.
The default treemap configuration in this view is:
- Block color: Benchmarked progress toward a specific target. Deep green means the goal is nearly achieved while a red color indicates that a system has a low achievement percentage for its objectives.
- Block size: the block size represents the relative volume change in a system over the selected period (the amount of code changed compared to the total system volume). This ensures that the systems with the most development activity are most prominent.
- Grouping: In the example, the systems are grouped based on whether a system currently satisfies its assigned policy (e.g., “Meeting criteria” vs. “Not meeting criteria”) but if you like, you can chose Team as a grouping.
Use Objective Progress to find out:
Which “Active” systems are moving away from their target? Is the gap to our target closing?
Remember: an overall objective progress KPI card is displayed at the top of the page, above the treemap. The Objective Progress shows you which teams might require your help to meet these targets.
Ratings
The Ratings views provides a quick insight into the current status of the portfolio, when it comes to maintainability rating. It does not visualize change, but rather the current state of the portfolio. The default treemap configuration in this view is:
- Block color: the color of the system blocks represents their current maintainability rating, benchmarked against the SIG maintainability benchmark.
- Block size: the size of the system blocks represents the current system volume (counted as rebuild volume in Person Years). Rebuild Volume is a normalized system volume indication which enables comparing system sizes across different technologies.
- Grouping: by default, the systems in the portfolio are grouped by team. This gives actionable insights in which teams might need help.
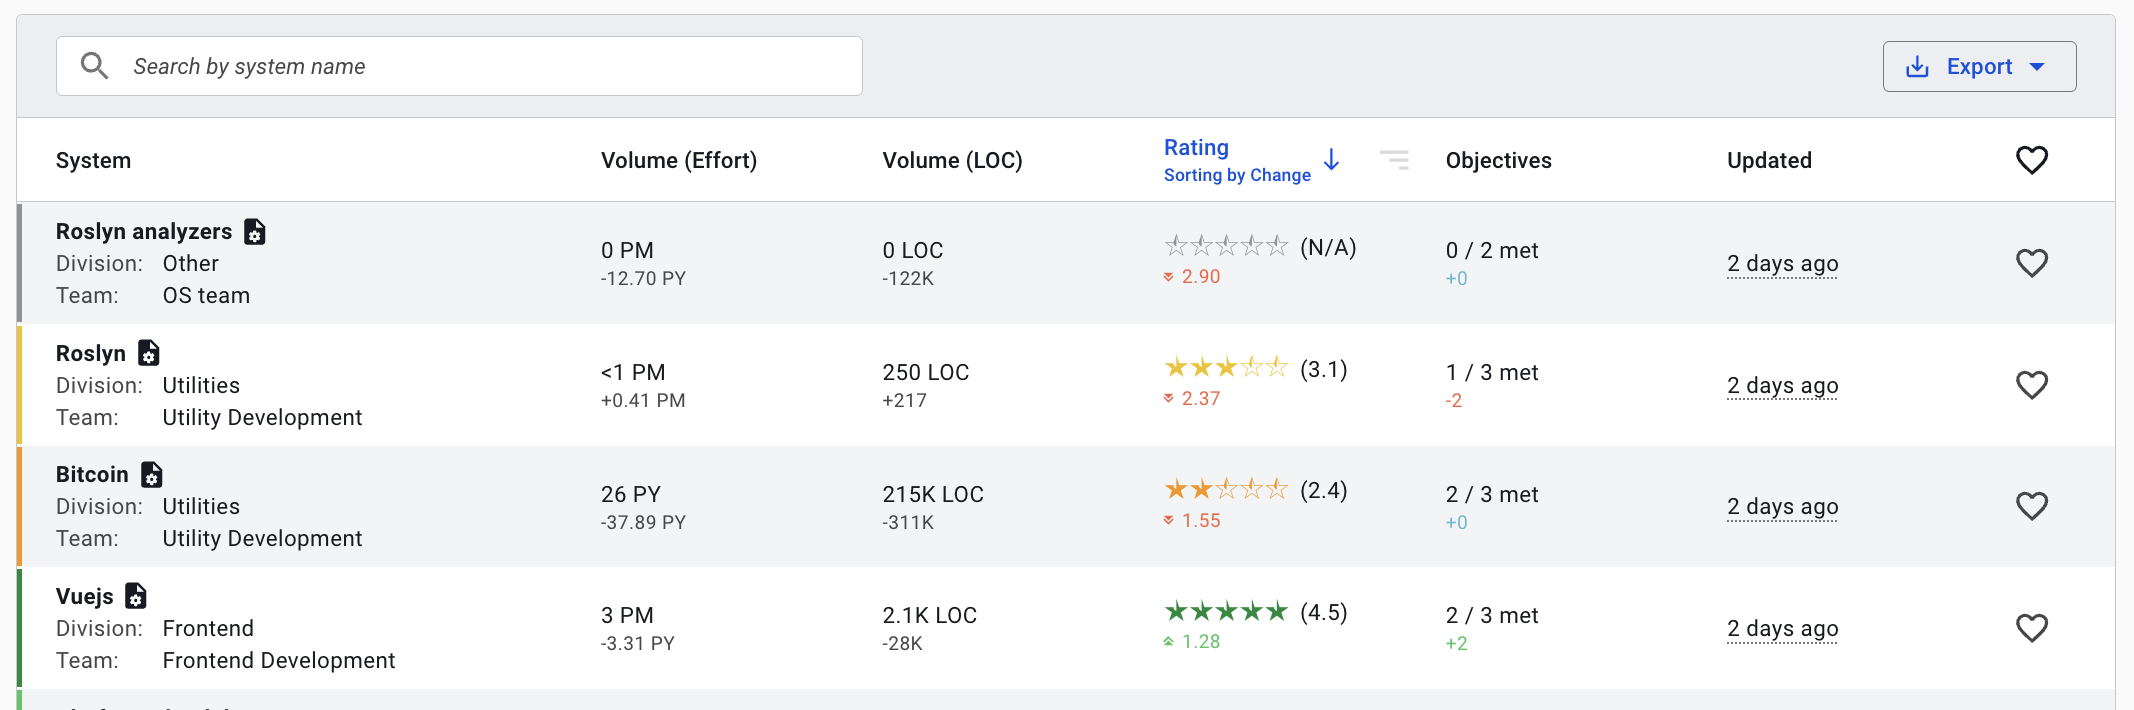
4. System table overview
The system table towards the bottom of the page provides a less focused, but more comprehensive, overview of the systems in your portfolio. It is useful in case you want to search for a specific system using the search functionality, or if you want to have a quick glance at volume (changes), quality changes, objective progress, and the last analysis moment. The table also enables you to favorite systems, and to sort on any of the columns.
How to learn more
- Go to SIG Academy and follow the Sigrid’s Portfolio-level Functionalities e-learning that covers the main aspects of Sigrid functionalities on portfolio level. You can access the SIG Academy via the graduation cap icon in the bottom left of your Sigrid window.
Contact and support
Feel free to contact SIG’s support team for any questions or issues you may have after reading this documentation or when using Sigrid.